12 minutes
Prometheus - Auto-deploying Consul and Exporters using Saltstack Part 6: MacOS
This is the sixth part in my ongoing series on using SaltStack to deploy Consul and Prometheus Exporters, enabling Prometheus to discover machines and services to monitor. You can view the other posts in the series below: -
All of the states are available in my Salt Lab repository.
Why MacOS?
Compared to the other systems covered so far, MacOS might seem an odd choice, as it is primarily a desktop operating system. However there are many cases where businesses have fleets of Mac devices requiring centralized management and monitoring that is scalable: -
- A render farm for video and/or animation
- Continuous Integration pipelines for iOS applications
- Building and signing MacOS applications
Companies like MacStadium offer Macs to customers in a cloud-like fashion for these kind of workloads, and there are other places (like in this article) that use Macs as part of their rendering workflow.
MacOS has its roots in Unix (FreeBSD and NeXTSTEP) so in some ways it is similar managing a BSD or illumos system. There are some differences in service management, but those used to Linux or Unix should not feel entirely out of place on the MacOS command line.
Configuring MacOS
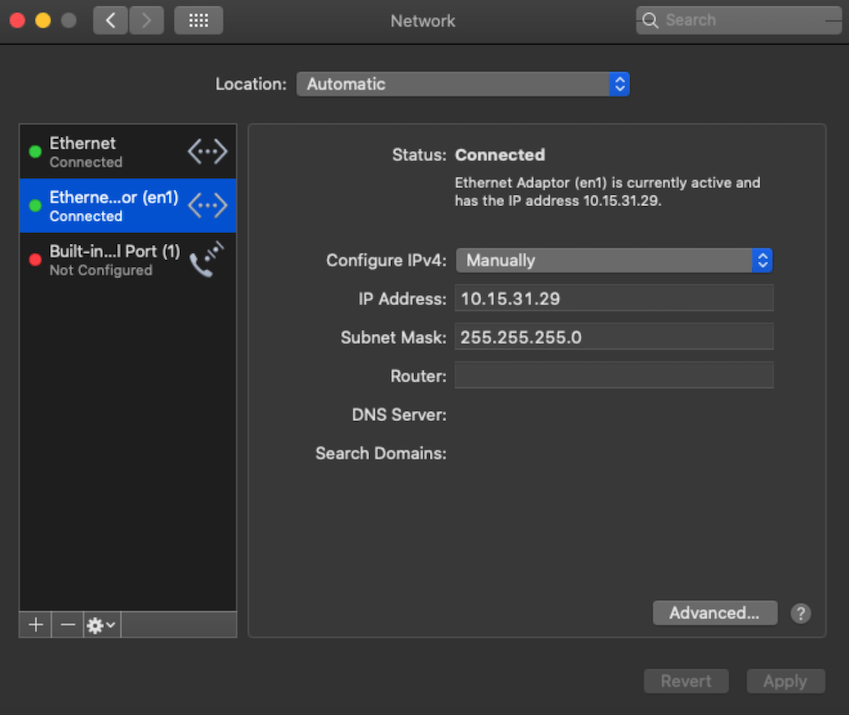
MacOS takes you through the steps of setting up your machine during the install process. If you need to set a static IP after installation, go to Applications > System Preferences > Network, and then set the IP under the correct interface: -
Installing the Salt Minion
To install the Salt Minion in MacOS, download the latest version from here, and then install by opening the executable and following the on-screen instructions. Once it is installed, you could configure it using: -
$ sudo salt-config -i yourminionname -m yoursaltmaster
Configuring the Salt Minion
Salt has an included minion configuration file. We replace the contents with the below: -
/etc/salt/minion
master: salt-master.yetiops.lab
id: macos-01.yetiops.lab
nodename: macos-01
You can then restart the Salt Minion using: -
$ sudo launchctl stop com.saltstack.salt.minion
$ sudo launchctl start com.saltstack.salt.minion
MacOS’s launchctl command does have a restart option, hence the need to stop and start the service.
You should now see this host attempt to register with the Salt Master: -
$ salt-key -L
Accepted Keys:
alpine-01.yetiops.lab
arch-01.yetiops.lab
centos-01.yetiops.lab
freebsd-01.yetiops.lab
omnios.yetiops.lab
openbsd-salt-01.yetiops.lab
salt-master.yetiops.lab
suse-01.yetiops.lab
ubuntu-01.yetiops.lab
void-01.yetiops.lab
win2019-01.yetiops.lab
Denied Keys:
Unaccepted Keys:
macos-01.yetiops.lab
Rejected Keys:
Accept the host with salt-key -a 'macos-01*'. Once this is done, you should now be able to manage the machine using Salt: -
$ salt 'macos*' test.ping
macos-01.yetiops.lab:
    True

$ salt 'macos*'  grains.item kernel
macos-01.yetiops.lab:
    ----------
    kernel:
        Darwin
Darwin is the base kernel that MacOS, iOS and Apple’s other OSs are built upon.
Salt States
We use two sets of states to deploy to MacOS. The first deploys Consul. The second deploys the Prometheus Node Exporter.
Applying Salt States
Once you have configured the states detailed below, use one of the following options to deploy the changes to the MacOS machine: -
salt '*' state.highstatefrom the Salt server (to configure every machine and every state)salt 'macos*' state.highstatefrom the Salt server (to configure all machines with a name beginning withmacos*, applying all states)salt 'macos*' state.apply consulfrom the Salt server (to configure all machines with a name beginning withmacos*, applying only theconsulstate)salt-call state.highstatefrom a machine running the Salt agent (to configure just one machine with all states)salt-call state.apply consulfrom a machine running the Salt agent (to configure just one machine with only theconsulstate)
You can also use the salt -C option to apply based upon grains, pillars or other types of matches. For example, to apply to all machines running an MacOS kernel, you could run salt -C 'G@kernel:Darwin' state.highstate.
Consul - Deployment
The following Salt state is used to deploy Consul onto a MacOS host: -
consul_binary:
  archive.extracted:
    - name: /usr/local/bin
    - source: https://releases.hashicorp.com/consul/1.7.3/consul_1.7.3_darwin_amd64.zip
    - source_hash: sha256=813eab12ae5c1b815c293c0453d1658dc34d123ac40f3b20c4b12258e0b1034c
    - enforce_toplevel: false
    - user: root
    - group: wheel
    - if_missing: /usr/local/bin/consul

consul_user:
  user.present:
    - name: consul
    - fullname: Consul
    - shell: /bin/false
    - home: /etc/consul.d

consul_group:
  group.present:
    - name: consul

/opt/consul:
  file.directory:
    - user: consul
    - group: consul
    - mode: 755
    - makedirs: True

/etc/consul.d:
  file.directory:
    - user: consul
    - group: consul
    - mode: 755
    - makedirs: True

/etc/consul.d/consul.hcl:
  file.managed:
{% if pillar['consul'] is defined %}
{% if pillar['consul']['server'] is defined %}
    - source: salt://consul/server/files/consul.hcl.j2
{% else %}
    - source: salt://consul/client/files/consul.hcl.j2
{% endif %}
{% endif %}
    - user: consul
    - group: consul
    - mode: 0640
    - template: jinja

/Library/LaunchDaemons/com.consul.consul.plist:
  file.managed:
    - source: salt://consul/client/files/consul-launchdaemon
    - user: root
    - group: wheel
    - mode: 644

consul_launchctl_load:
   cmd.run:
    - name: launchctl load /Library/LaunchDaemons/com.consul.consul.plist
    - watch:
       - file: /Library/LaunchDaemons/com.consul.consul.plist


consul_service:
  cmd.run:
    - name: launchctl stop com.consul.consul; launchctl start com.consul.consul
    - watch:
      - file: /etc/consul.d/consul.hcl

{% if pillar['consul'] is defined %}
{% if pillar['consul']['prometheus_services'] is defined %}
{% for service in pillar['consul']['prometheus_services'] %}
/etc/consul.d/{{ service }}.hcl:
  file.managed:
    - source: salt://consul/services/files/{{ service }}.hcl
    - user: consul
    - group: consul
    - mode: 0640
    - template: jinja

consul_reload_{{ service }}:
  cmd.run:
    - name: /usr/local/bin/consul reload
    - watch:
      - file: /etc/consul.d/{{ service }}.hcl
{% endfor %}
{% endif %}
{% endif %}
This state is similar to the states used for Linux or illumos.
Hashicorp provide MacOS binaries for Consul, so we can use the archive.extracted state to download it and extract it. After that, the main differences from the other states are how MacOS defines and uses services.
The service is defined in a plist file, which looks like the below: -
/srv/salt/states/consul/client/files/consul-launchdaemon
<?xml version="1.0" encoding="UTF-8"?>
<!DOCTYPE plist PUBLIC "-//Apple//DTD PLIST 1.0//EN" "http://www.apple.com/DTDs/PropertyList-1.0.dtd">
<plist version="1.0">
  <dict>
    <key>Label</key>
    <string>com.consul.consul</string>
    <key>RunAtLoad</key>
    <true/>
    <key>KeepAlive</key>
    <true/>
    <key>ProgramArguments</key>
    <array>
        <string>/usr/local/bin/consul</string>
        <string>agent</string>
        <string>-config-dir</string>
        <string>/etc/consul.d</string>
    </array>
    <key>SoftResourceLimits</key>
    <dict>
        <key>NumberOfFiles</key>
        <integer>100000</integer>
    </dict>
    <key>HardResourceLimits</key>
    <dict>
        <key>NumberOfFiles</key>
        <integer>100000</integer>
    </dict>
    <!-- uncomment the lines below to debug launchd issues -->
    <!--
    <key>StandardOutPath</key>
    <string>/tmp/consul.out</string>
    <key>StandardErrorPath</key>
    <string>/tmp/consul.err</string>
    -->
  </dict>
</plist>
Like illumos/Solaris, MacOS defines services using XML. The relevant fields are: -
Key: Label- This is the name of the service (com.consul.consul)RunAtLoad: True- This ensures the service starts on bootKeepAlive: True- This makes sure that the service keeps running, rather than being a one time executionProgramArguments- This contains the parameters we use to run Consul (with each argument on a different line)
There are also other parameters like Soft and Hard Resource limits (which control how many files can be open on the system, and how many can be open per process), as well as some debugging options.
The command launchctl load /Library/LaunchDaemons/com.consul.consul.plist imports the plist file. This is only reimported if the contents of the service file change.
After that, the service is stopped and started, to ensure it will pick up any changes made to the service in future.
The final section regarding Consul services is the same as we use in the other parts in this series. This adds all services that Prometheus can then discover.
This state is applied to MacOS machines as such: -
base:
  'G@init:systemd and G@kernel:Linux':
    - match: compound
    - consul
    - exporters.node_exporter.systemd

  'os:Alpine':
    - match: grain
    - consul.alpine
    - exporters.node_exporter.alpine

  'os:Void':
    - match: grain
    - consul.void
    - exporters.node_exporter.void

  'kernel:OpenBSD':
    - match: grain
    - consul.openbsd
    - exporters.node_exporter.bsd

  'kernel:FreeBSD':
    - match: grain
    - consul.freebsd
    - exporters.node_exporter.bsd
    - exporters.gstat_exporter.freebsd

  'kernel:SunOS':
    - match: grain
    - consul.illumos
    - exporters.node_exporter.illumos

  'kernel:Darwin':
    - match: grain
    - consul.macos

  'kernel:Windows':
    - match: grain
    - consul.windows
    - exporters.windows_exporter.win_exporter
    - exporters.windows_exporter.windows_exporter
We match the kernel grain, ensuring the value is Darwin: -
$ salt 'macos*' grains.item kernel
macos-01.yetiops.lab:
    ----------
    kernel:
        Darwin
Pillars
We use the same pillars for MacOS as we do for Linux, OpenBSD and illumos: -
consul.sls
consul:
  data_dir: /opt/consul
  prometheus_services:
  - node_exporter
consul-dc.sls
consul:
  dc: yetiops
  enc_key: ###CONSUL_KEY###
  servers:
  - salt-master.yetiops.lab
These pillars reside in /srv/salt/pillars/consul. They are applied as such: -
base:
  '*':
    - consul.consul-dc

  'G@kernel:Linux or G@kernel:OpenBSD or G@kernel:FreeBSD or G@kernel:SunOS or G@kernel:Darwin':
    - match: compound
    - consul.consul

  'kernel:FreeBSD':
    - match: grain
    - consul.consul-freebsd

  'kernel:Windows':
    - match: grain
    - consul.consul-client-win

  'salt-master*':
    - consul.consul-server
To match MacOS, we add the G@kernel:Darwin part to our original match statement (to include the standard consul.consul pillar).
Consul - Verification
We can verify that Consul is working with the below: -
$ consul members
Node                         Address           Status  Type    Build  Protocol  DC       Segment
salt-master                  10.15.31.5:8301   alive   server  1.7.3  2         yetiops  <all>
alpine-01                    10.15.31.27:8301  alive   client  1.7.3  2         yetiops  <default>
arch-01                      10.15.31.26:8301  alive   client  1.7.3  2         yetiops  <default>
centos-01.yetiops.lab        10.15.31.24:8301  alive   client  1.7.3  2         yetiops  <default>
freebsd-01.yetiops.lab       10.15.31.21:8301  alive   client  1.7.2  2         yetiops  <default>
macos-01.local               10.15.31.29:8301  alive   client  1.7.3  2         yetiops  <default>
omnios-01                    10.15.31.20:8301  alive   client  1.7.3  2         yetiops  <default>
openbsd-salt-01.yetiops.lab  10.15.31.23:8301  alive   client  1.7.2  2         yetiops  <default>
suse-01                      10.15.31.22:8301  alive   client  1.7.3  2         yetiops  <default>
ubuntu-01                    10.15.31.33:8301  alive   client  1.7.3  2         yetiops  <default>
void-01                      10.15.31.31:8301  alive   client  1.7.2  2         yetiops  <default>
win2019-01                   10.15.31.25:8301  alive   client  1.7.2  2         yetiops  <default>

$ consul catalog nodes -service node_exporter
Node                         ID        Address      DC
alpine-01                    e59eb6fc  10.15.31.27  yetiops
arch-01                      97c67201  10.15.31.26  yetiops
centos-01.yetiops.lab        78ac8405  10.15.31.24  yetiops
freebsd-01.yetiops.lab       3e7b0ce8  10.15.31.21  yetiops
macos-01.local               9a2687e5  10.15.31.29  yetiops
omnios-01                    7c736402  10.15.31.20  yetiops
openbsd-salt-01.yetiops.lab  c87bfa18  10.15.31.23  yetiops
salt-master                  344fb6f2  10.15.31.5   yetiops
suse-01                      d2fdd88a  10.15.31.22  yetiops
ubuntu-01                    4544c7ff  10.15.31.33  yetiops
void-01                      e99c7e3c  10.15.31.31  yetiops
Node Exporter - Deployment
Now that Consul is up and running, we will install the Prometheus Node Exporter.
States
The following Salt state is used to deploy the Prometheus Node Exporter onto a MacOS host: -
{% if not salt['file.file_exists']('/usr/local/bin/node_exporter') %}
extract_node_exporter:
  archive.extracted:
    - name: /usr/local/bin
    - enforce_toplevel: false
    - source: https://github.com/prometheus/node_exporter/releases/download/v1.0.0/node_exporter-1.0.0.darwin-amd64.tar.gz
    - source_hash: sha256=68eec397b0b88767508aab9ec5214070b5877daef33fb94b1377aa245bb90d01
    - archive_format: tar
    - user: root
    - group: wheel

move_node_exporter:
  file.rename:
    - name: /usr/local/bin/node_exporter
    - source: /usr/local/bin/node_exporter-1.0.0.darwin-amd64/node_exporter

delete_node_exporter_dir:
  file.absent:
    - name: /usr/local/bin/node_exporter-1.0.0.darwin-amd64/

delete_node_exporter_files:
  file.absent:
    - name: /usr/local/bin/node_exporter-1.0.0.darwin-amd64.tar.gz
{% endif %}

node_exporter_user:
  user.present:
    - name: node_exporter
    - fullname: Node Exporter
    - shell: /bin/false

node_exporter_group:
  group.present:
    - name: node_exporter

/opt/prometheus/exporters/dist/textfile:
  file.directory:
    - user: node_exporter
    - group: node_exporter
    - mode: 755
    - makedirs: True

/Library/LaunchDaemons/com.prometheus.node_exporter.plist:
  file.managed:
    - source: salt://exporters/node_exporter/files/node_exporter-launchdaemon
    - user: root
    - group: wheel
    - mode: 644

node_exporter_launchctl_load:
   cmd.run:
    - name: launchctl load /Library/LaunchDaemons/com.prometheus.node_exporter.plist
    - watch:
       - file: /Library/LaunchDaemons/com.prometheus.node_exporter.plist

node_exporter_service:
  cmd.run:
    - name: launchctl stop com.prometheus.node_exporter; launchctl start com.prometheus.node_exporter
This state is very similar to the Linux state.
The first part downloads the node_exporter binary from GitHub, and extracts the contents. This extracts the contents to /usr/local/bin/node_exporter-1.0.0.darwin-amd64/. We then move the node_exporter binary into /usr/local/bin directory.
Finally, we clean up the the directory created by the archive, and remove the archive as well. These steps are executed if the node_exporter binary is not already /usr/local/bin.
After that, we create the Node Exporter user, group, textfile directory, and then define the service (using plist files like in the Consul deployment).
The contents of the plist are: -
/srv/salt/states/exporters/node_exporter/files/node_exporter-launchdaemon
<?xml version="1.0" encoding="UTF-8"?>
<!DOCTYPE plist PUBLIC "-//Apple//DTD PLIST 1.0//EN" "http://www.apple.com/DTDs/PropertyList-1.0.dtd">
<plist version="1.0">
  <dict>
    <key>Label</key>
    <string>com.prometheus.node_exporter</string>
    <key>RunAtLoad</key>
    <true/>
    <key>KeepAlive</key>
    <true/>
    <key>ProgramArguments</key>
    <array>
        <string>/usr/local/bin/node_exporter</string>
        <string>--collector.textfile</string>
        <string>--collector.textfile.directory=/opt/prometheus/exporters/dist/textfile</string>
    </array>
    <key>SoftResourceLimits</key>
    <dict>
        <key>NumberOfFiles</key>
        <integer>100000</integer>
    </dict>
    <key>HardResourceLimits</key>
    <dict>
        <key>NumberOfFiles</key>
        <integer>100000</integer>
    </dict>
    <!-- uncomment the lines below to debug launchd issues -->
    <!--
    <key>StandardOutPath</key>
    <string>/tmp/node_exporter.out</string>
    <key>StandardErrorPath</key>
    <string>/tmp/node_exporter.err</string>
    -->
  </dict>
</plist>
This is very similar to the Consul service. The main differences are: -
- The label is
com.prometheus.node_exporter(used when restarting the service) - The ProgramArguments (as it is a different service)
We apply the state with the following: -
base:
  'G@init:systemd and G@kernel:Linux':
    - match: compound
    - consul
    - exporters.node_exporter.systemd

  'os:Alpine':
    - match: grain
    - consul.alpine
    - exporters.node_exporter.alpine

  'os:Void':
    - match: grain
    - consul.void
    - exporters.node_exporter.void

  'kernel:OpenBSD':
    - match: grain
    - consul.openbsd
    - exporters.node_exporter.bsd

  'kernel:FreeBSD':
    - match: grain
    - consul.freebsd
    - exporters.node_exporter.bsd
    - exporters.gstat_exporter.freebsd

  'kernel:SunOS':
    - match: grain
    - consul.illumos
    - exporters.node_exporter.illumos

  'kernel:Darwin':
    - match: grain
    - consul.macos
    - exporters.node_exporter.macos

  'kernel:Windows':
    - match: grain
    - consul.windows
    - exporters.windows_exporter.win_exporter
    - exporters.windows_exporter.windows_exporter
Pillars
There are no pillars in this lab specific to the Node Exporter.
Node Exporter - Verification
After this, we should be able to see the node_exporter running and producing metrics: -
# Check the service is enabled
$ launchctl list com.prometheus.node_exporter
{
	"LimitLoadToSessionType" = "System";
	"Label" = "com.prometheus.node_exporter";
	"OnDemand" = false;
	"LastExitStatus" = 0;
	"PID" = 108;
	"Program" = "/usr/local/bin/node_exporter";
	"ProgramArguments" = (
		"/usr/local/bin/node_exporter";
		"--collector.textfile";
		"--collector.textfile.directory=/opt/prometheus/exporters/dist/textfile";
	);
};

$ launchctl list | grep -iE "pid|node_exporter"
PID	Status	Label
108	0	com.prometheus.node_exporter

# Check it is listening
$ netstat -an | grep -i 9100
tcp4       0      0  10.15.31.29.9100       10.15.31.254.59210     ESTABLISHED
tcp46      0      0  *.9100                 *.*                    LISTEN

# Check it responds
$ curl 10.15.31.29:9100/metrics  | grep -i uname
node_uname_info{domainname="(none)",machine="x86_64",nodename="macos-01",release="19.5.0",sysname="Darwin",version="Darwin Kernel Version 19.5.0: Thu Apr 30 18:25:59 PDT 2020; root:xnu-6153.121.1~7/RELEASE_X86_64"} 1
All looks good!
Prometheus Targets
As Prometheus is already set up (see here), and matches on the prometheus tag, we should see this within the Prometheus targets straight away: -
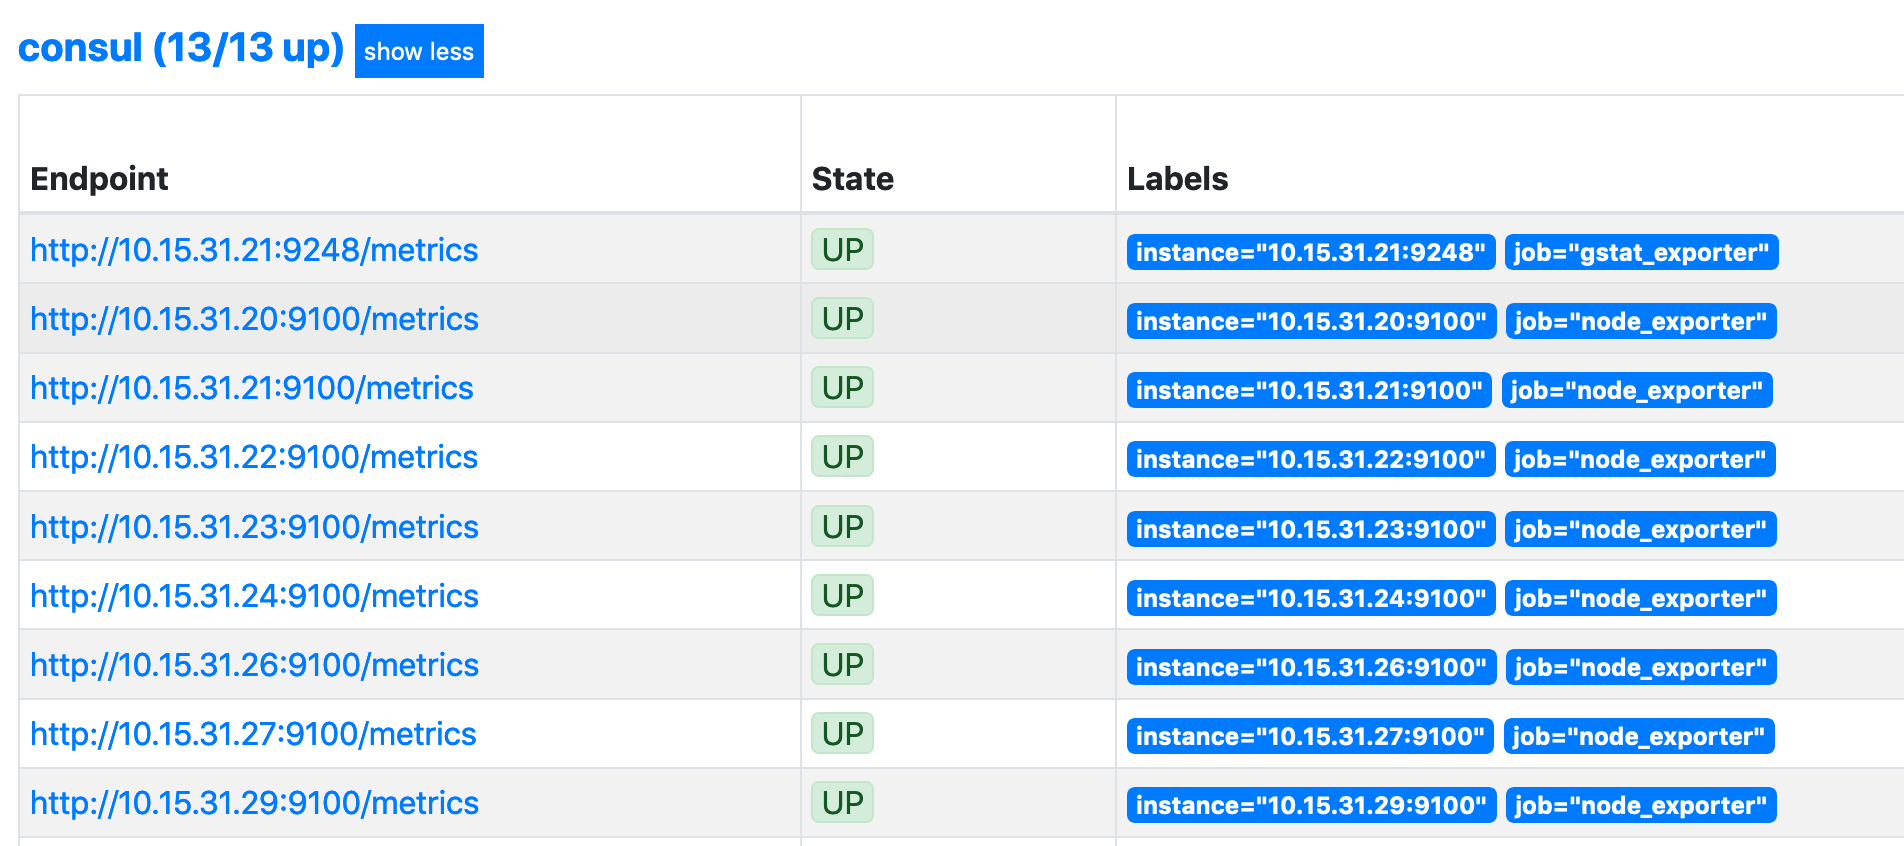
The last host in the list is the MacOS machine
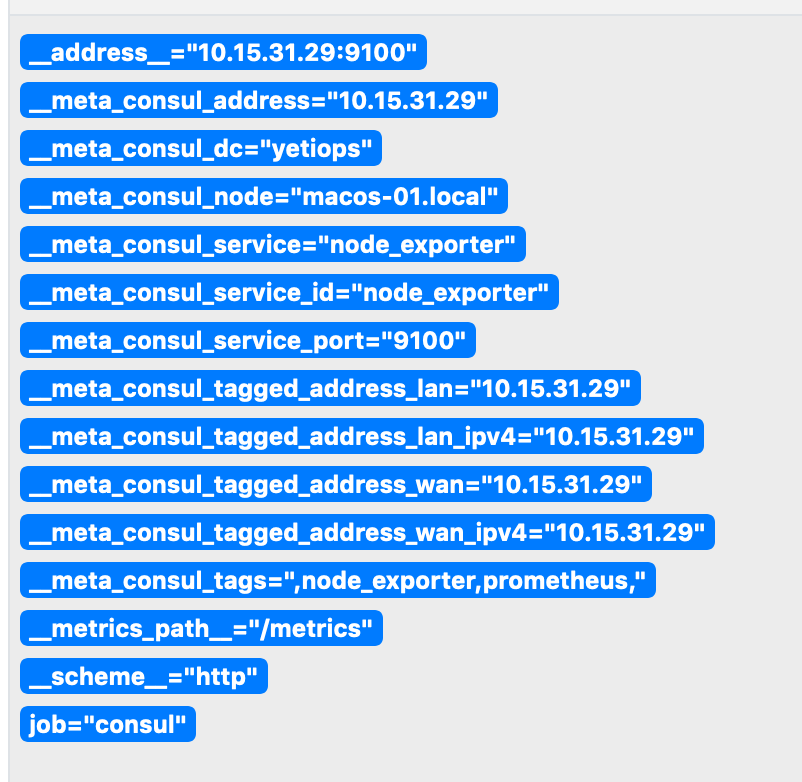
Above is the Metadata we receive from Consul about this host.
Grafana
If we use the Node Exporter Full dashboard, most of the metrics are available: -
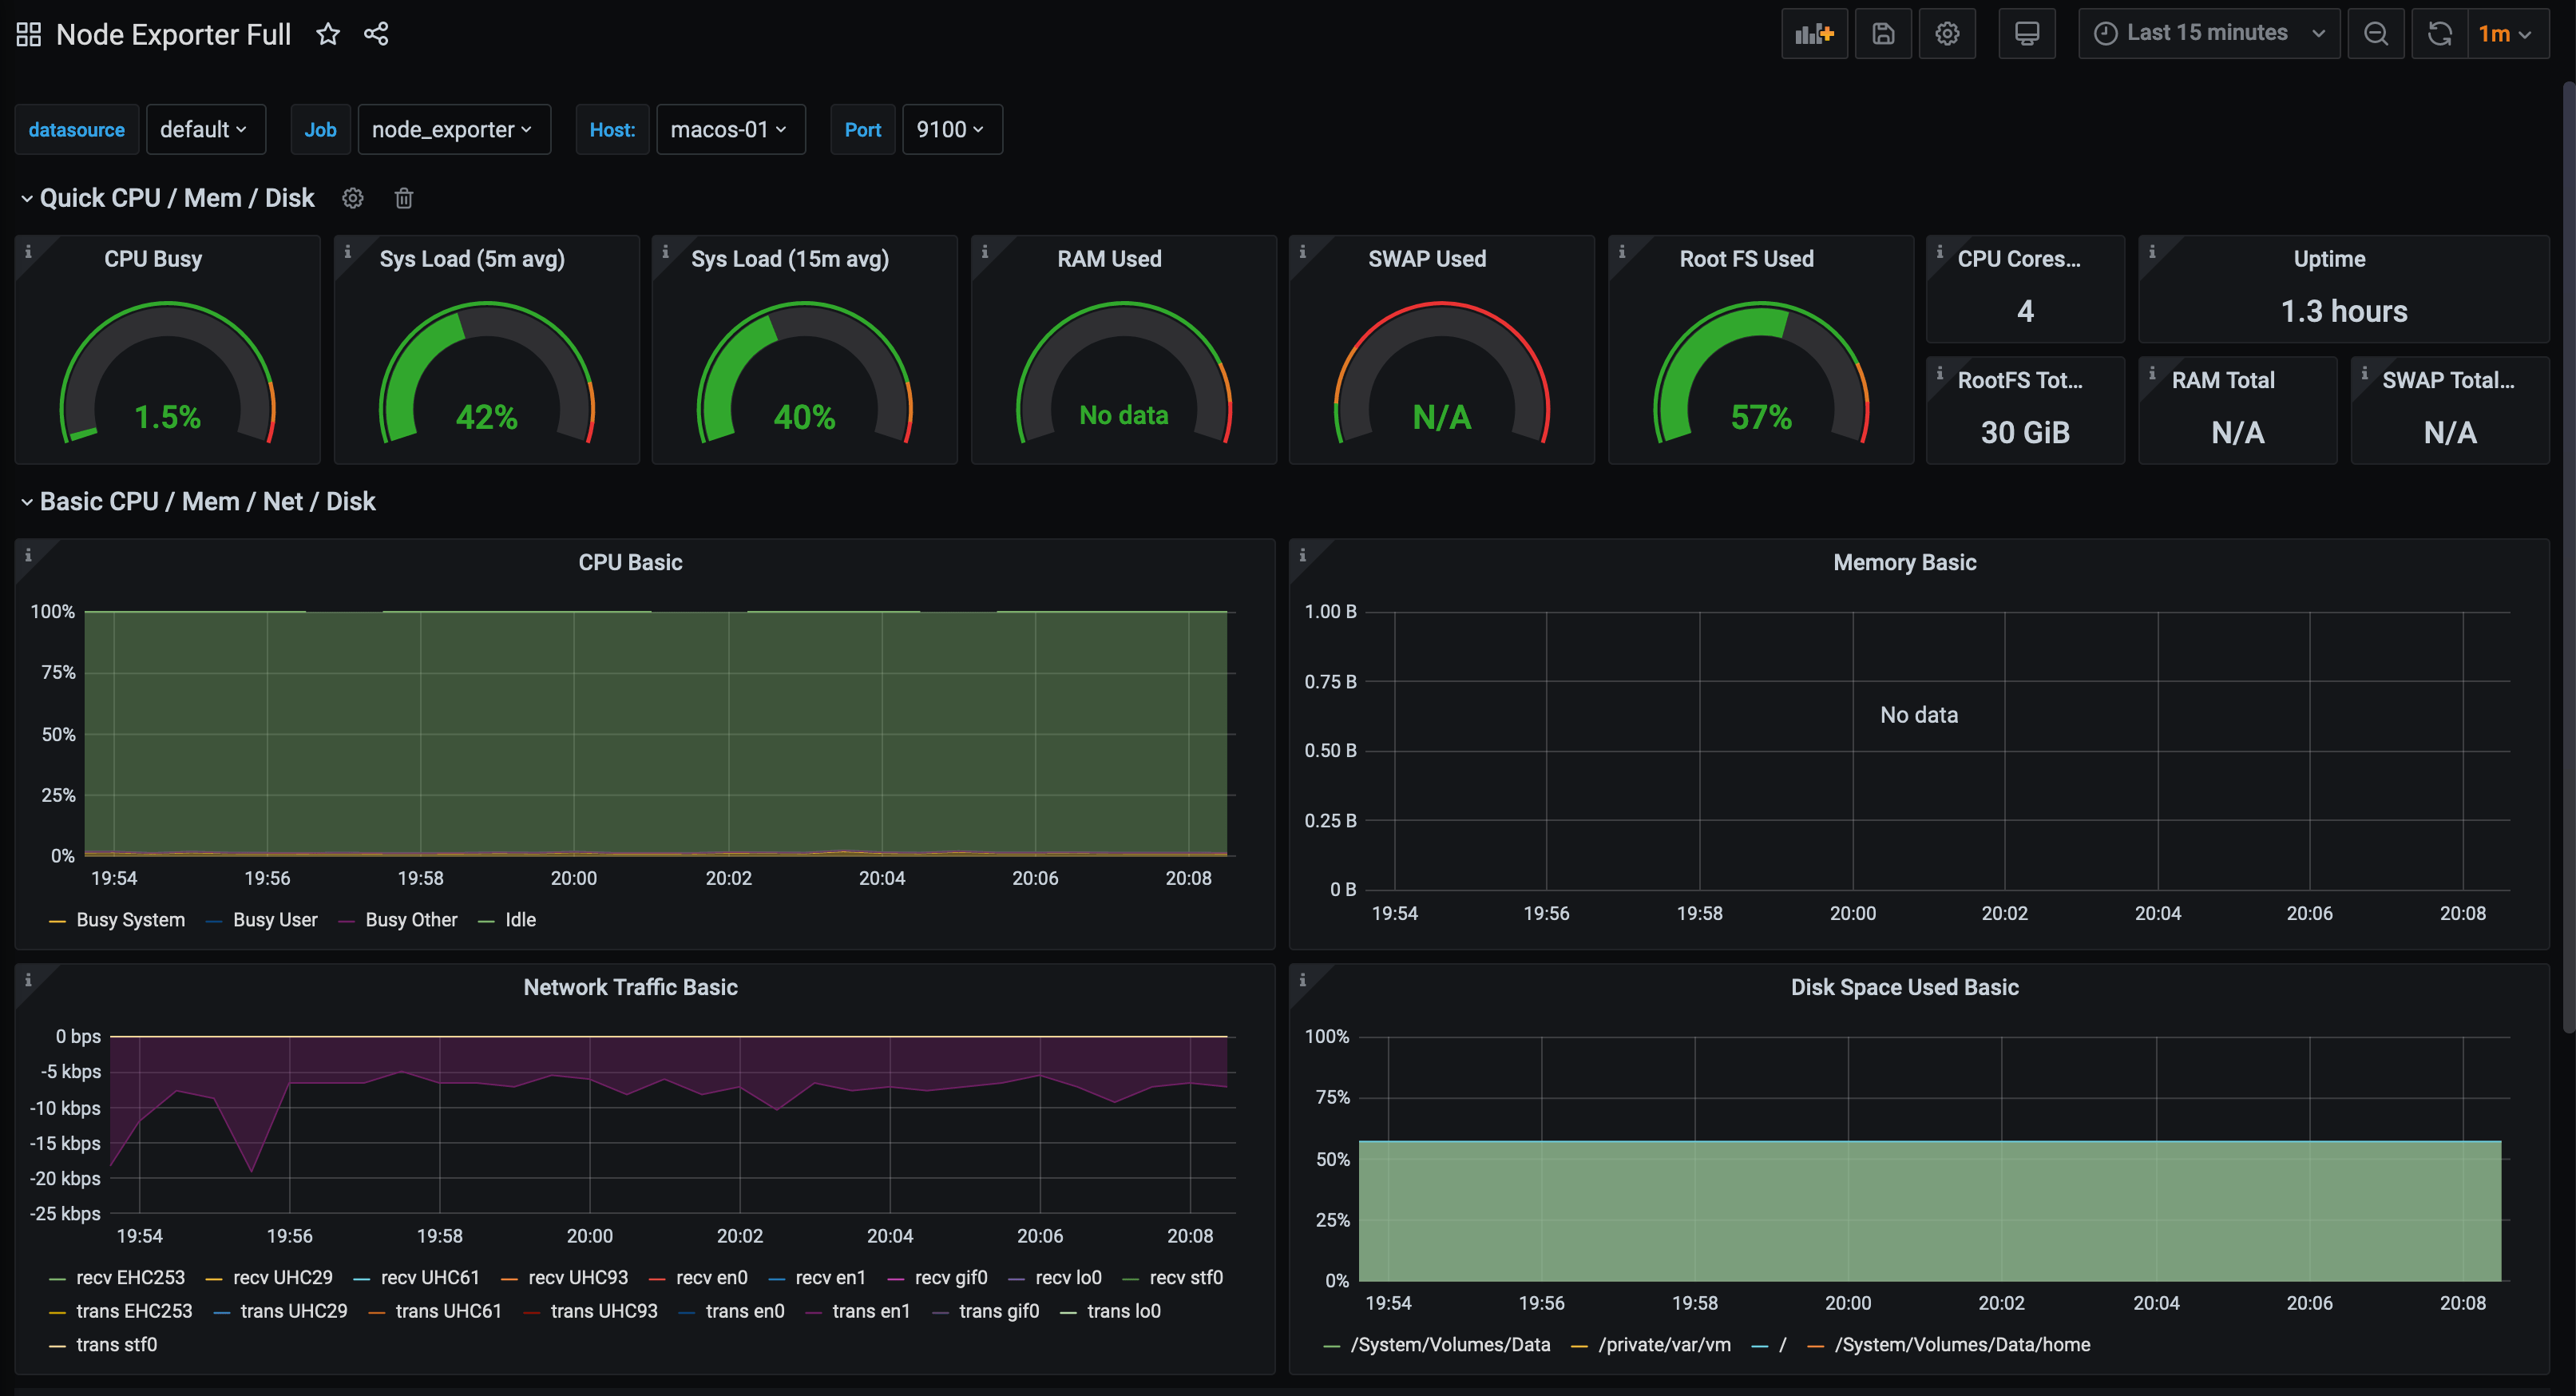
In the above, the graphs for memory are missing. This is where we can use some of the BSD heritage of MacOS, by using the Node Exporter FreeBSD dashboard: -
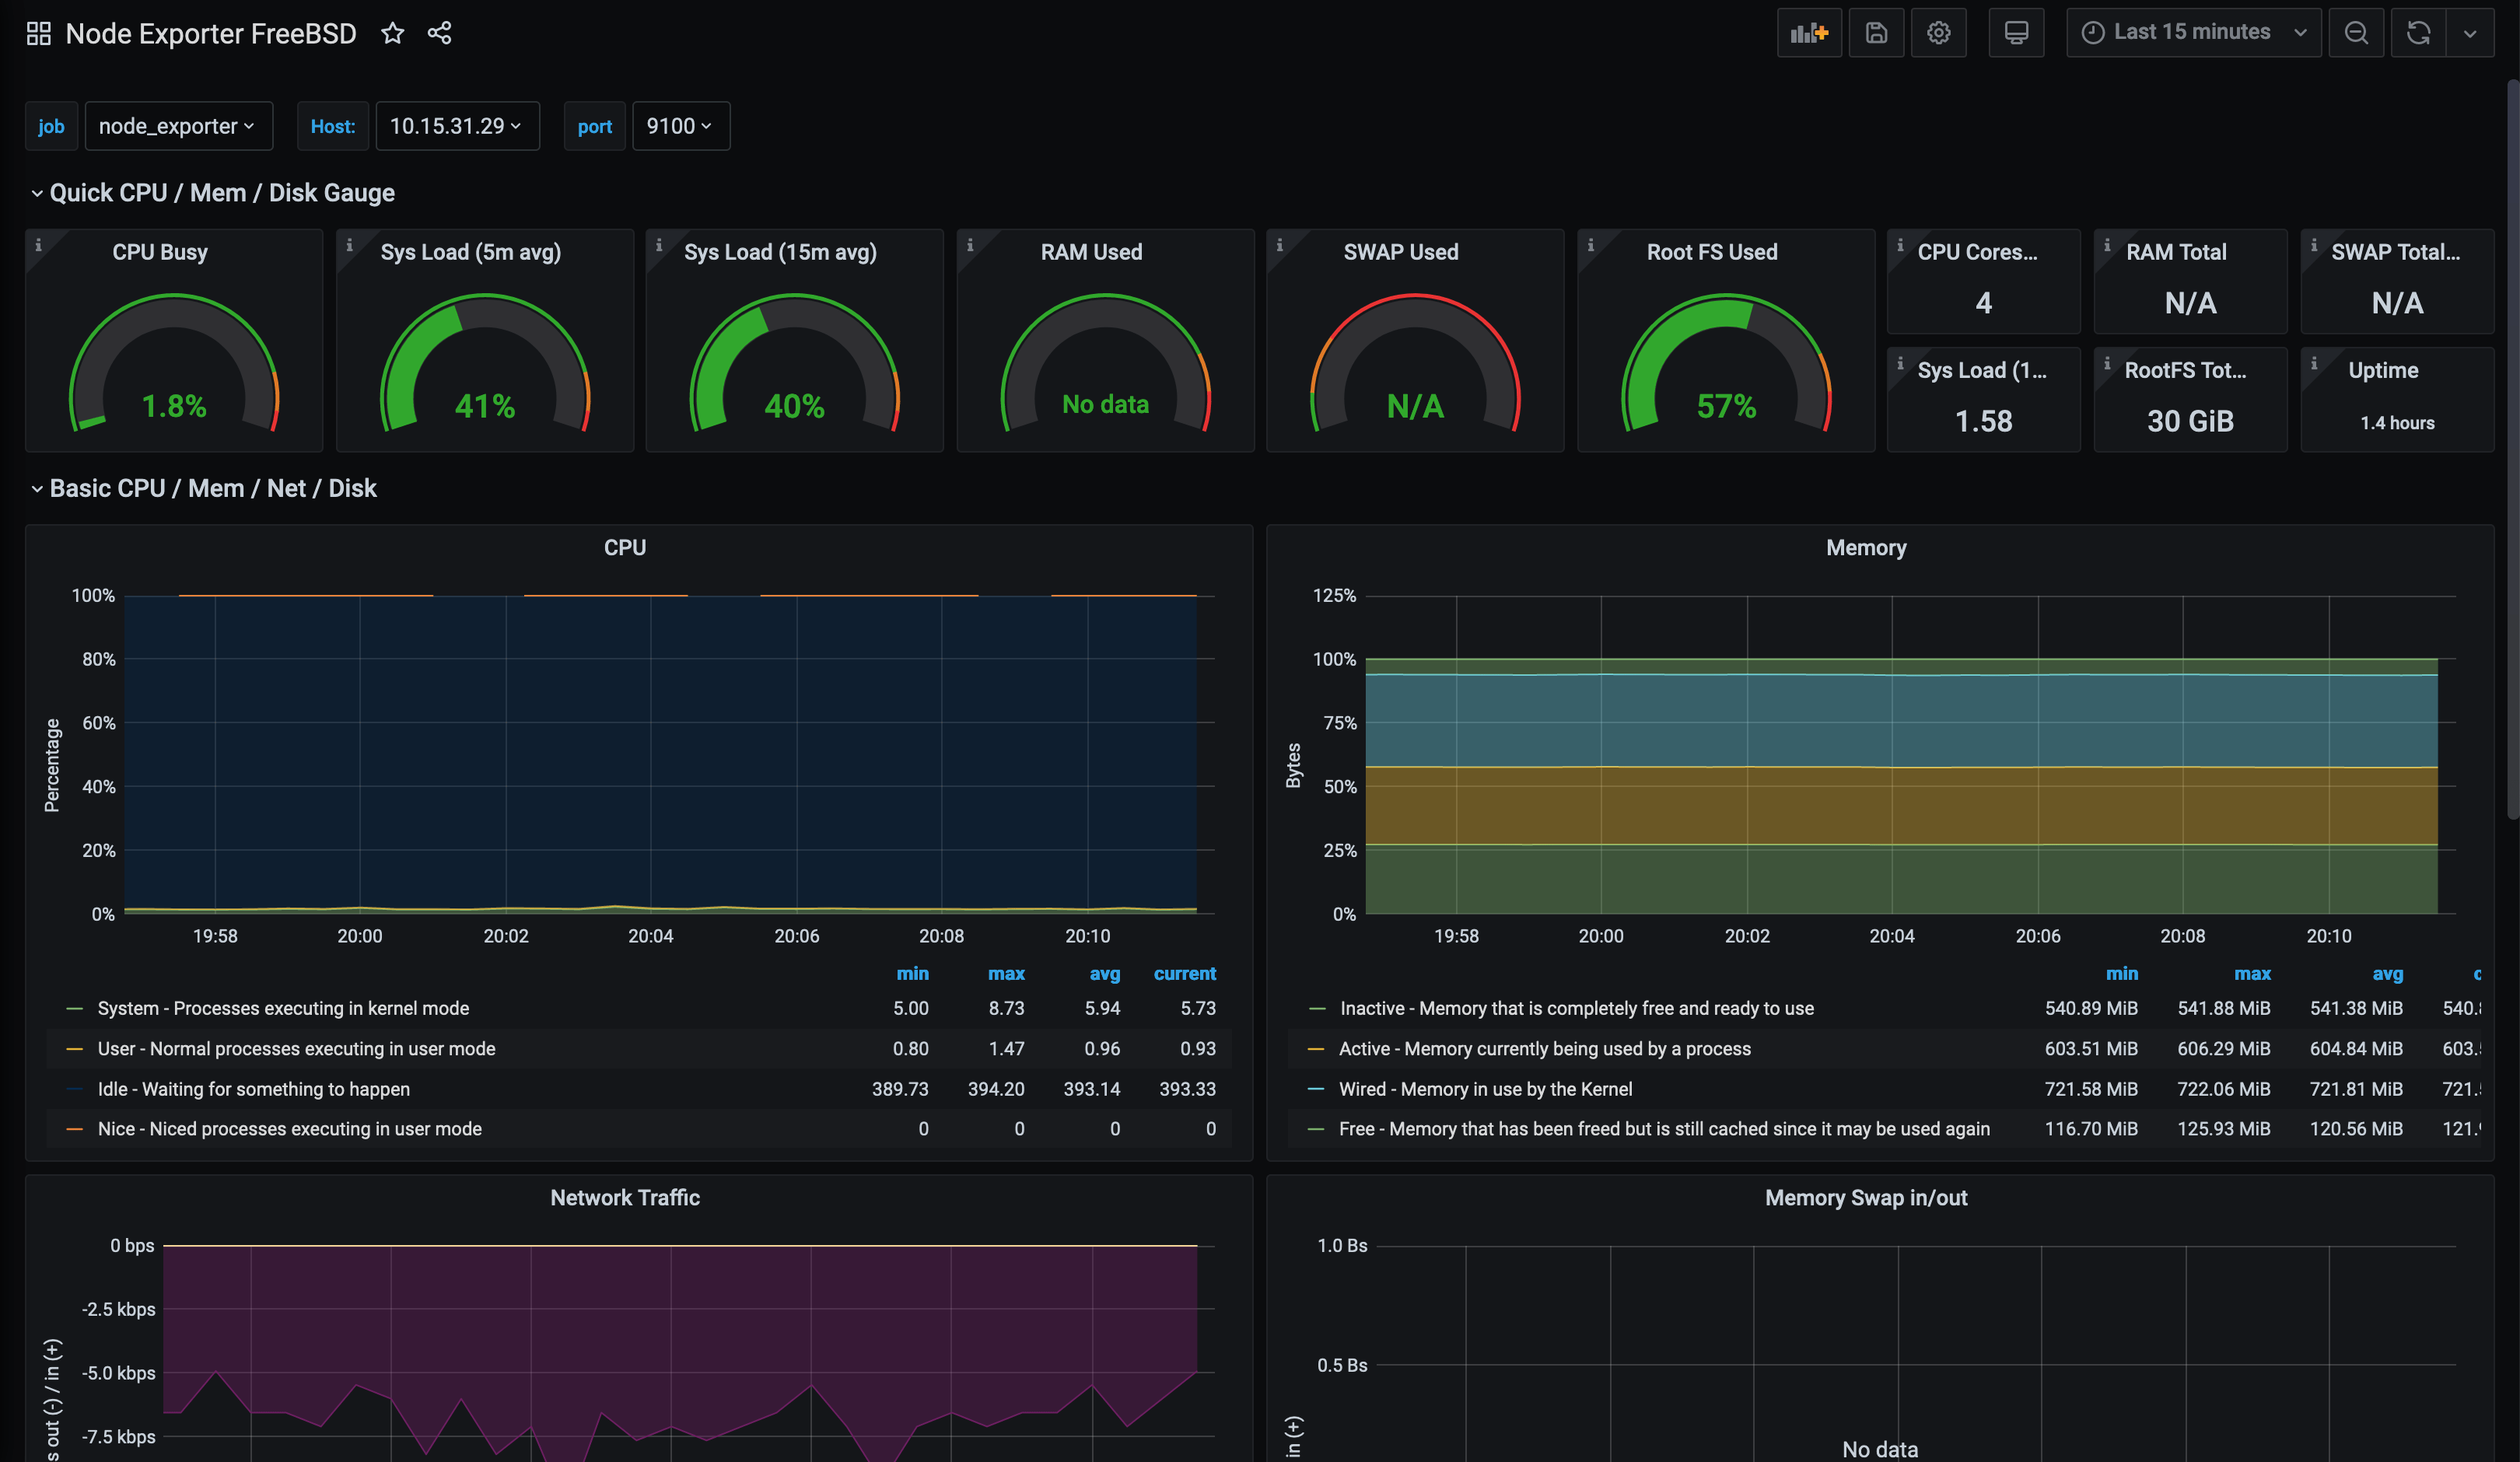
While we are still missing some metrics, we have more available than in the previous dashboard. With some tweaking to this dashboard, we can see all of the values: -
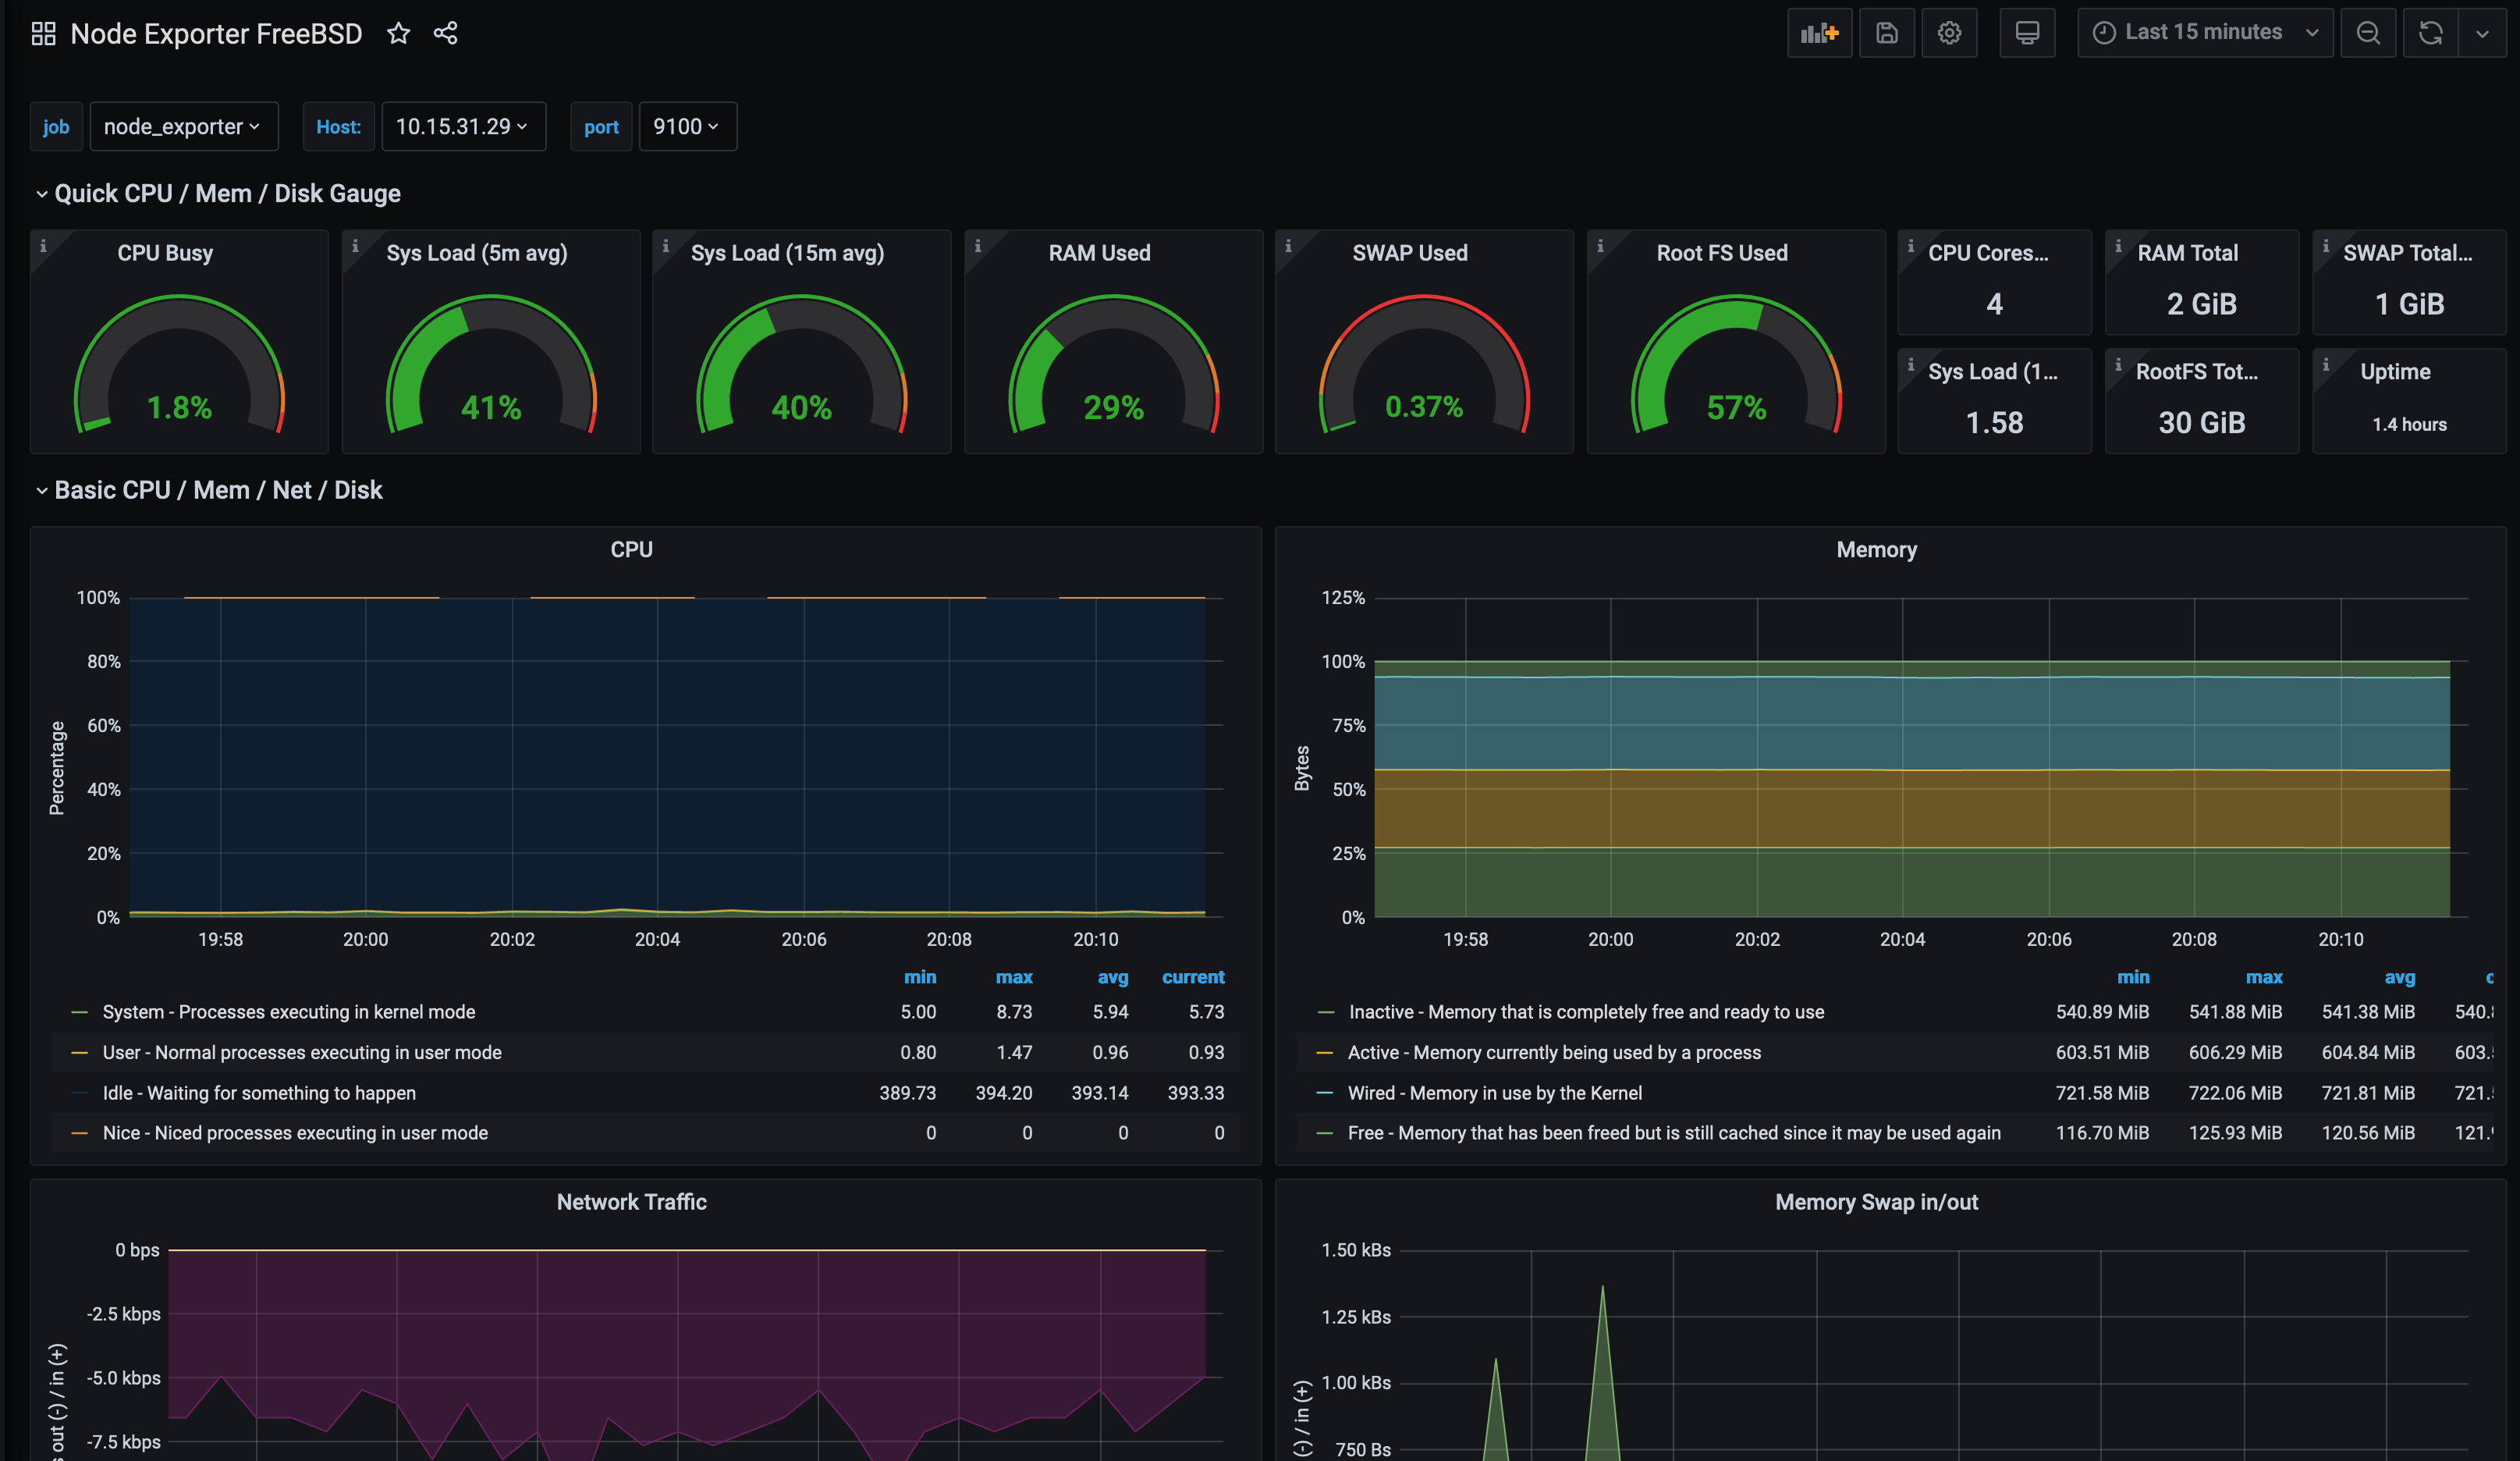
This does mean that the dashboard would no longer work for FreeBSDs hosts, so you would need to duplicate it and update the graphs accordingly.
Summary
If, like me, you have used Macs for a number of years, you have probably used GUI utilities to manage them. However the capabilities are available to manage them like any other server operating system. Using something like SaltStack allows you to integrate MacOS alongside other systems with little effort.
As with all the systems we have covered, using the same tools to configure, manage and monitor your infrastructure is invaluable. If your infrastructure includes the need to build iOS applications, or you are managing a render farm in conjunction with Linux, Windows, BSD or illumos, you can use Prometheus and Grafana as your one pane of glass to monitor everything.
This post is the last in the series on managing and monitoring different operating systems using SaltStack, Consul and Prometheus. I hope those who read this series find it useful, and I am more than willing to include systems not already covered in future posts (suggestions in the comments!).
devops monitoring prometheus consul saltstack macos
technical prometheus monitoring config management
2385 Words
2020-07-08 17:02 +0000