16 minutes
Prometheus - Auto-deploying Consul and Exporters using Saltstack Part 5: illumos
This is the fifth part in my ongoing series on using SaltStack to deploy Consul and Prometheus Exporters, enabling Prometheus to discover machines and services to monitor. You can view the other posts in the series below: -
All of the states (as well as those for future posts, if you want a quick preview) are available in my Salt Lab repository.
Why illumos?
illumos is a continuation of Sun Microsystem’s OpenSolaris. It is technically a fork, starting around the time of the Oracle acquisition of Sun. As part of this acquisition, Oracle moved all development of Solaris (and other products) from open source to a closed source model.
Like Linux, there are multiple distributions of illumos. Notable examples are OpenIndiana (aimed at being user friendly), SmartOS (for building cloud and hypervisor platforms) and OmniOS (a minimal server base).
illumos and Solaris are still used in some businesses, whether through supporting legacy systems or just a preference for the Solaris way of administering systems.
Which distribution?
To create this post, I decided to use OmniOS. With its minimal base, we can install what we need to show how to monitor an illumos (or even Solaris) system with few resources and extra packages.
Configuring OmniOS
The fresh installation walkthrough for OmniOS is a great resource for installing the system and getting up and running. Also, because a lot of the tools to configure networking and storage are similar (and in some cases) the same as Solaris, most Solaris guides will apply to OmniOS as well.
You can set a static IP in the installer, but if you need to configure it after installation, you can do the following: -
# Get the list of interfaces
$ dladm show-link
LINK        CLASS     MTU    STATE    BRIDGE     OVER
e1000g0     phys      1500   up       --         --
e1000g1     phys      1500   up       --         --

# Show the current list of configured IPv4 and IPv6 addresses
$ ipadm
ADDROBJ           TYPE     STATE        ADDR
lo0/v4            static   ok           127.0.0.1/8
e1000g0/dhcp      dhcp     ok           192.168.122.93/24
lo0/v6            static   ok           ::1/128

# Add a static IP address to the e1000g1 interface
$ ipadm create-addr -T static -a 10.15.31.20/24 e1000g1/v4

# Show that the IP address was added
$ ipadm
ADDROBJ           TYPE     STATE        ADDR
lo0/v4            static   ok           127.0.0.1/8
e1000g0/dhcp      dhcp     ok           192.168.122.93/24
e1000g1/v4        static   ok           10.15.31.20/24
lo0/v6            static   ok           ::1/128
Installing the Salt Minion
Salt is not included in the OmniOS package archives, so we need to compile it from source. The Solaris instructions in SaltStack’s documentation do work, but only after we install a prerequisite library.
The library we need to install is ZeroMQ, which is not available in the OmniOS package archives.
To build ZeroMQ from source, you can do the following: -
# Install the dependencies first
$ pkg install developer/gcc7 developer/build/gnu-make developer/build/libtool developer/build/autoconf developer/build/automake developer/pkg-config developer/macro/gnu-m4

# Clone the repository from GitHub
$ git clone https://github.com/zeromq/libzmq.git
$ cd libzmq

# Generate the "configure" script
$ ./autogen.sh

# Configure, make and install
$ MAKE="gmake" ./configure
$ gmake
$ sudo gmake install
The reason for using gmake (i.e. gnu-make) rather than just make is that some of the macros and other functions within the Makefile use GNU-specific terms. This means that the illumos/Solaris make will not be able to build ZeroMQ.
After you have installed the above, you should then be able to use the instructions to install Salt: -
$ git clone https://github.com/saltstack/salt
$ cd salt
$ sudo python setup.py install --force
After this, Salt should be installed and ready to use: -
$ which salt-minion
/usr/bin/salt-minion

$ salt-minion --version
salt-minion 3001
Creating a service
As Salt is not packaged for illumos, it does not come with any included service files. We will need to create our own to ensure that the Minion starts on boot and runs in the background.
In Solaris and illumos, we can use service manifests to define the methods we can use to execute the service. For the Salt Minion We also have the method file, which is a shell script that the manifest uses to control the Salt Minion binary.
/lib/svc/manifest/system/salt-minion.xml
<?xml version='1.0'?>
<!DOCTYPE service_bundle SYSTEM '/usr/share/lib/xml/dtd/service_bundle.dtd.1'>
<!--
Service manifest for salt-minion
-->

<service_bundle type='manifest' name='salt-minion:salt-minion'>

<service
  name='network/salt-minion'
  type='service'
  version='1'>
  <create_default_instance enabled='false' />
  <single_instance />

  <dependency name='fs'
    grouping='require_all'
    restart_on='none'
    type='service'>
    <service_fmri value='svc:/system/filesystem/local' />
  </dependency>

  <dependency name='net'
    grouping='require_all'
    restart_on='none'
    type='service'>
    <service_fmri value='svc:/network/loopback' />
  </dependency>

  <exec_method
    type='method'
    name='start'
    exec='/lib/svc/method/svc-salt-minion start'
    timeout_seconds='120'>
  </exec_method>

  <exec_method
    type='method'
    name='stop'
    exec='/lib/svc/method/svc-salt-minion stop'
    timeout_seconds='60'>
  </exec_method>

  <exec_method
    type='method'
    name='restart'
    exec='/lib/svc/method/svc-salt-minion restart'
    timeout_seconds='180'>
  </exec_method>

</service>

</service_bundle>
This is in XML format. It defines the dependencies (i.e. the file system is available, and the network is up), and that we can start, stop or restart the service.
This is imported using sudo svccfg import /lib/svc/manifest/system/salt-minion.xml.
We also need to create the method file as well: -
/lib/svc/method/svc-salt-minion
#!/bin/sh
#
#AUTOENABLE no
#

CONF_DIR=/opt/local/etc/salt
PIDFILE=/var/run/salt-minion.pid
SALTMINION=/usr/bin/salt-minion

[ ! -d ${CONF_DIR} ] &&  exit $CONF_DIR

start_service() {
        /bin/rm -f ${PIDFILE}
        $SALTMINION -d -c ${CONF_DIR} 2>&1
}

stop_service() {
        if [ -f "$PIDFILE" ]; then
                /usr/bin/kill -TERM `/usr/bin/cat $PIDFILE`
        fi
}

case "$1" in
start)
        start_service
        ;;
stop)
        stop_service
        ;;
restart)
        stop_service
        sleep 1
        start_service
        ;;
*)
        echo "Usage: $0 {start|stop|restart}"
        exit 1
        ;;
esac
This is not too dissimilar from a SysVInit script or an rc.d script.
Once this is done, enable the service using svcadm enable salt-minion. You can then check the status with: -
$ svcs salt-minion
STATE          STIME    FMRI
online         15:40:15 svc:/network/salt-minion:default
Configuring the Salt Minion
Salt has an included minion configuration file. We replace the contents with the below: -
master: salt-master.yetiops.lab
id: omnios.yetiops.lab
nodename: omnios
On illumos, this file resides in /opt/local/etc/salt/minion. Restart the Salt Minion to enable this configuration using svcadm restart salt-minion.
You should now see this host attempt to register with the Salt Master: -
$ salt-key -L
Accepted Keys:
alpine-01.yetiops.lab
arch-01.yetiops.lab
centos-01.yetiops.lab
freebsd-01.yetiops.lab
openbsd-salt-01.yetiops.lab
salt-master.yetiops.lab
suse-01.yetiops.lab
ubuntu-01.yetiops.lab
void-01.yetiops.lab
win2019-01.yetiops.lab
Denied Keys:
Unaccepted Keys:
omnios.yetiops.lab
Rejected Keys:
Accept the host with salt-key -a 'omnios-01*'. Once this is done, you should now be able to manage the machine using Salt: -
$ salt 'omnios*' test.ping
omnios.yetiops.lab:
    True

$ salt 'omnios*' grains.item kernel
omnios.yetiops.lab:
    ----------
    kernel:
        SunOS
Interestingly, the kernel reports as SunOS rather than illumos or Solaris. This means that we can use this across both illumos and Solaris-based systems.
Salt States
We use two sets of states to deploy to illumos. The first deploys Consul. The second deploys the Prometheus Node Exporter.
Applying Salt States
Once you have configured the states detailed below, use one of the following options to deploy the changes to the illumos machine: -
salt '*' state.highstatefrom the Salt server (to configure every machine and every state)salt 'omnios*' state.highstatefrom the Salt server (to configure all machines with a name beginning withomnios*, applying all states)salt 'omnios*' state.apply consulfrom the Salt server (to configure all machines with a name beginning withomnios*, applying only theconsulstate)salt-call state.highstatefrom a machine running the Salt agent (to configure just one machine with all states)salt-call state.apply consulfrom a machine running the Salt agent (to configure just one machine with only theconsulstate)
You can also use the salt -C option to apply based upon grains, pillars or other types of matches. For example, to apply to all machines running a SunOS (i.e. Solaris/illumos) kernel, you could run salt -C 'G@kernel:SunOS' state.highstate.
Consul - Deployment
The following Salt state is used to deploy Consul onto an illumos host: -
consul_binary:
  archive.extracted:
    - name: /usr/bin
    - source: https://releases.hashicorp.com/consul/1.7.3/consul_1.7.3_solaris_amd64.zip
    - source_hash: sha256=af49c5ff0639977d1efc9e5ef30277842c6bab90f53e4758b22b18e224e14bb1
    - enforce_toplevel: false
    - user: root
    - group: root
    - if_missing: /usr/bin/consul

consul_user:
  user.present:
    - name: consul
    - fullname: Consul
    - shell: /bin/false
    - home: /etc/consul.d

consul_group:
  group.present:
    - name: consul

/opt/consul:
  file.directory:
    - user: consul
    - group: consul
    - mode: 755
    - makedirs: True

/opt/local/etc/consul.d:
  file.directory:
    - user: consul
    - group: consul
    - mode: 755
    - makedirs: True

/lib/svc/manifest/system/consul.xml:
  file.managed:
    - source: salt://consul/client/files/consul-svc-manifest
    - user: root
    - group: sys
    - mode: 0640

consul_import_svc:
  cmd.run:
    - name: svccfg import /lib/svc/manifest/system/consul.xml
    - watch:
       - file: /lib/svc/manifest/system/consul.xml

/opt/local/etc/consul.d/consul.hcl:
  file.managed:
{% if pillar['consul'] is defined %}
{% if pillar['consul']['server'] is defined %}
    - source: salt://consul/server/files/consul.hcl.j2
{% else %}
    - source: salt://consul/client/files/consul.hcl.j2
{% endif %}
{% endif %}
    - user: consul
    - group: consul
    - mode: 0640
    - template: jinja

consul_service:
  service.running:
    - name: consul
    - enable: True
    - reload: True
    - watch:
      - file: /opt/local/etc/consul.d/consul.hcl

{% if pillar['consul'] is defined %}
{% if pillar['consul']['prometheus_services'] is defined %}
{% for service in pillar['consul']['prometheus_services'] %}
/opt/local/etc/consul.d/{{ service }}.hcl:
  file.managed:
    - source: salt://consul/services/files/{{ service }}.hcl
    - user: consul
    - group: consul
    - mode: 0640
    - template: jinja

consul_reload_{{ service }}:
  cmd.run:
    - name: consul reload
    - watch:
      - file: /opt/local/etc/consul.d/{{ service }}.hcl
{% endfor %}
{% endif %}
{% endif %}
Hashicorp provide Consul binaries for Solaris, meaning we do not need to compile it ourselves. To summarise what we are doing in this state: -
- Download the Consul binary archive and extract its contents, but only if
/usr/bin/consuldoes not exist already - Create a Consul user and group
- Create the
/opt/consuldirectory (for Consul to hold its state and runtime configuration) - Create the
/opt/local/etc/consul.ddirectory (for Consul configuration files) - Adds a Service manifest file
- Imports the Service manifest, if the Service manifest has changed
- There are no Salt states that imports manifest files, so we use
cmd.run(i.e. running an ad-hoc command on the host) to import it
- There are no Salt states that imports manifest files, so we use
- Adds the Consul configuration and services
Most of this state is similar to how we deploy Consul on Linux. The biggest difference is the use of the the manifest files, rather than SystemD-unit files or otherwise: -
/srv/salt/states/consul/client/files/consul-svc-manifest
<?xml version="1.0"?>
<!DOCTYPE service_bundle SYSTEM "/usr/share/lib/xml/dtd/service_bundle.dtd.1">
<!--
        Created by Manifold
-->
<service_bundle type="manifest" name="consul">

    <service name="site/consul" type="service" version="1">

        <create_default_instance enabled="true"/>

        <single_instance/>

        <dependency name="network" grouping="require_all" restart_on="error" type="service">
            <service_fmri value="svc:/milestone/network:default"/>
        </dependency>

        <dependency name="filesystem" grouping="require_all" restart_on="error" type="service">
            <service_fmri value="svc:/system/filesystem/local"/>
        </dependency>

        <method_context>
            <method_credential user="consul" group="consul"/>
        </method_context>

        <exec_method type="method" name="start" exec="/usr/bin/consul agent -config-dir %{config_dir}" timeout_seconds="60"/>

        <exec_method type="method" name="stop" exec=":kill" timeout_seconds="60"/>
<exec_method type="method" name="refresh" exec=":kill -HUP" timeout_seconds="10"/>
        <property_group name="startd" type="framework">
            <propval name="duration" type="astring" value="child"/>
            <propval name="ignore_error" type="astring" value="core,signal"/>
        </property_group>

        <property_group name="application" type="application">
            <propval name="config_dir" type="astring" value="/opt/local/etc/consul.d"/>
        </property_group>

        <stability value="Evolving"/>

        <template>
            <common_name>
                <loctext xml:lang="C">
                    Consul service discovery
                </loctext>
            </common_name>
        </template>

    </service>

</service_bundle>
This file was sourced from here. Unlike the Salt service manifest, this file calls the Consul binary directly, rather than using a method script.
This state is applied to illumos machine as such: -
base:
  'G@init:systemd and G@kernel:Linux':
    - match: compound
    - consul
    - exporters.node_exporter.systemd

  'os:Alpine':
    - match: grain
    - consul.alpine
    - exporters.node_exporter.alpine

  'os:Void':
    - match: grain
    - consul.void
    - exporters.node_exporter.void

  'kernel:OpenBSD':
    - match: grain
    - consul.openbsd
    - exporters.node_exporter.bsd

  'kernel:FreeBSD':
    - match: grain
    - consul.freebsd
    - exporters.node_exporter.bsd
    - exporters.gstat_exporter.freebsd

  'kernel:SunOS':
    - match: grain
    - consul.illumos

  'kernel:Windows':
    - match: grain
    - consul.windows
    - exporters.windows_exporter.win_exporter
    - exporters.windows_exporter.windows_exporter
We match the kernel grain, ensuring the value is SunOS: -
$ salt 'omnios*' grains.item kernel
omnios.yetiops.lab:
    ----------
    kernel:
        SunOS
Pillars
We use the consul.sls and the consul-dc.sls pillars as we do with Linux, OpenBSD and FreeBSD.
consul.sls
consul:
  data_dir: /opt/consul
  prometheus_services:
  - node_exporter
consul-dc.sls
consul:
  dc: yetiops
  enc_key: ###CONSUL_KEY###
  servers:
  - salt-master.yetiops.lab
We are not using any additional exporters, so no extra pillars need defining.
These pillars reside in /srv/salt/pillars/consul. They are applied as such: -
base:
  '*':
    - consul.consul-dc

  'G@kernel:Linux or G@kernel:OpenBSD or G@kernel:FreeBSD or G@kernel:SunOS':
    - match: compound
    - consul.consul

  'kernel:FreeBSD':
    - match: grain
    - consul.consul-freebsd

  'kernel:Windows':
    - match: grain
    - consul.consul-client-win

  'salt-master*':
    - consul.consul-server
To match illumos or Solaris, we add the G@kernel:SunOS part to our original match statement (to include the standard consul.consul pillar).
Consul - Verification
We can verify that Consul is working with the below: -
$ consul members
Node                         Address           Status  Type    Build  Protocol  DC       Segment
salt-master                  10.15.31.5:8301   alive   server  1.7.3  2         yetiops  <all>
alpine-01                    10.15.31.27:8301  alive   client  1.7.3  2         yetiops  <default>
arch-01                      10.15.31.26:8301  alive   client  1.7.3  2         yetiops  <default>
centos-01.yetiops.lab        10.15.31.24:8301  alive   client  1.7.3  2         yetiops  <default>
freebsd-01.yetiops.lab       10.15.31.21:8301  alive   client  1.7.2  2         yetiops  <default>
omnios-01                    10.15.31.20:8301  alive   client  1.7.3  2         yetiops  <default>
openbsd-salt-01.yetiops.lab  10.15.31.23:8301  alive   client  1.7.2  2         yetiops  <default>
suse-01                      10.15.31.22:8301  alive   client  1.7.3  2         yetiops  <default>
ubuntu-01                    10.15.31.33:8301  alive   client  1.7.3  2         yetiops  <default>
void-01                      10.15.31.31:8301  alive   client  1.7.2  2         yetiops  <default>
win2019-01                   10.15.31.25:8301  alive   client  1.7.2  2         yetiops  <default>

$ consul catalog nodes -service node_exporter
Node                         ID        Address      DC
alpine-01                    e59eb6fc  10.15.31.27  yetiops
arch-01                      97c67201  10.15.31.26  yetiops
centos-01.yetiops.lab        78ac8405  10.15.31.24  yetiops
freebsd-01.yetiops.lab       3e7b0ce8  10.15.31.21  yetiops
omnios-01                    7c736402  10.15.31.20  yetiops
openbsd-salt-01.yetiops.lab  c87bfa18  10.15.31.23  yetiops
salt-master                  344fb6f2  10.15.31.5   yetiops
suse-01                      d2fdd88a  10.15.31.22  yetiops
ubuntu-01                    4544c7ff  10.15.31.33  yetiops
void-01                      e99c7e3c  10.15.31.31  yetiops
Node Exporter - Building from source
As with SaltStack, there are no released builds for Solaris-like systems, nor do they exist in the OmniOS package manager. Because of this, we now need to build this from source as well.
To do this, first we need to install the Go programming language on the system: -
$ pkg install ooce/developer/go-114
After this, we can create a temporary Go environment and build the node_exporter: -
$ export GOPATH=/tmp/go
$ go get github.com/prometheus/node_exporter
$ cd /tmp/go/src/github.com/prometheus/node_exporter
Rather than using make (or gmake to ensure it works with the GNU-specific macros), use make build (or gmake build), which will generate the correct binaries.
You may encounter an error during this process like the below: -
make: *** [Makefile.common:240: /tmp/go/bin/promu] Error 3 ***
If you want to build the full suite of Prometheus applications, this maybe be an issue. However, if you only need the node_exporter binary, then it should have already generated before this error. Go to /tmp/go/bin and you should see the node_exporter binary.
This post is very useful in describing how to compile the node_exporter binary on OmniOS. Unlike the author of this post, I didn’t seem to need the promu binary to build for the node_exporter binary to compile.
To make use of this binary, I placed it in /srv/salt/states/exporters/node_exporter/files/node_exporter_illumos so that Salt can deploy it to all illumos/Solaris hosts.
Node Exporter - Deployment
Now that the Node Exporter has been compiled and Consul is running, we can run the states to deploy it.
States
The following Salt state is used to deploy the Prometheus Node Exporter onto an illumos host: -
/srv/salt/states/exporters/node_exporter/illumos.sls
node_exporter_binary:
  file.managed:
    - name: /usr/bin/node_exporter
    - source: salt://exporters/node_exporter/files/node_exporter_illumos
    - user: root
    - group: bin
    - mode: 0755

node_exporter_user:
  user.present:
    - name: node_exporter
    - fullname: Node Exporter
    - shell: /bin/false

node_exporter_group:
  group.present:
    - name: node_exporter

/opt/prometheus/exporters/dist/textfile:
  file.directory:
    - user: node_exporter
    - group: node_exporter
    - mode: 755
    - makedirs: True

/lib/svc/manifest/system/node_exporter.xml:
  file.managed:
    - source: salt://exporters/node_exporter/files/node_exporter-svc-manifest
    - user: root
    - group: sys
    - mode: 0640

node_exporter_import_svc:
  cmd.run:
    - name: svccfg import /lib/svc/manifest/system/node_exporter.xml
    - watch:
       - file: /lib/svc/manifest/system/node_exporter.xml

node_exporter_service:
  service.running:
    - name: node_exporter
    - enable: True
    - reload: True
As with the previous state, we need to create a Service manifest and deploy it. We also add the node_exporter binary that we compiled in the previous stage.
The Service manifest file looks like the below: -
/srv/salt/states/exporters/node_exporter/files/node_exporter-svc-manifest
<?xml version="1.0"?>
<!DOCTYPE service_bundle SYSTEM "/usr/share/lib/xml/dtd/service_bundle.dtd.1">
<!--
        Created by Manifold
-->
<service_bundle type="manifest" name="node_exporter">

    <service name="site/node_exporter" type="service" version="1">

        <create_default_instance enabled="true"/>

        <single_instance/>

        <dependency name="network" grouping="require_all" restart_on="error" type="service">
            <service_fmri value="svc:/milestone/network:default"/>
        </dependency>

        <dependency name="filesystem" grouping="require_all" restart_on="error" type="service">
            <service_fmri value="svc:/system/filesystem/local"/>
        </dependency>

        <method_context>
            <method_credential user="node_exporter" group="node_exporter"/>
        </method_context>

        <exec_method type="method" name="start" exec="/usr/bin/node_exporter --collector.textfile --collector.textfile.directory=%{textfile_dir}" timeout_seconds="60"/>

        <exec_method type="method" name="stop" exec=":kill" timeout_seconds="60"/>
<exec_method type="method" name="refresh" exec=":kill -HUP" timeout_seconds="10"/>
        <property_group name="startd" type="framework">
            <propval name="duration" type="astring" value="child"/>
            <propval name="ignore_error" type="astring" value="core,signal"/>
        </property_group>

        <property_group name="application" type="application">
            <propval name="textfile_dir" type="astring" value="/opt/prometheus/exporters/dist/textfile"/>
        </property_group>

        <stability value="Evolving"/>

        <template>
            <common_name>
                <loctext xml:lang="C">
                    Node Exporter
                </loctext>
            </common_name>
        </template>

    </service>

</service_bundle>
This manifest is very similar to the one we used in the Consul deployment (the Consul service was used as a starting point to create this one). This is imported using the svccfg command in the node_exporter_import_svc section of the state file.
We apply the state with the following: -
base:
  'G@init:systemd and G@kernel:Linux':
    - match: compound
    - consul
    - exporters.node_exporter.systemd

  'os:Alpine':
    - match: grain
    - consul.alpine
    - exporters.node_exporter.alpine

  'os:Void':
    - match: grain
    - consul.void
    - exporters.node_exporter.void

  'kernel:OpenBSD':
    - match: grain
    - consul.openbsd
    - exporters.node_exporter.bsd

  'kernel:FreeBSD':
    - match: grain
    - consul.freebsd
    - exporters.node_exporter.bsd
    - exporters.gstat_exporter.freebsd

  'kernel:SunOS':
    - match: grain
    - consul.illumos
    - exporters.node_exporter.illumos

  'kernel:Windows':
    - match: grain
    - consul.windows
    - exporters.windows_exporter.win_exporter
    - exporters.windows_exporter.windows_exporter
Pillars
There are no pillars in this lab specific to the Node Exporter.
Node Exporter - Verification
After this, we should be able to see the node_exporter running and producing metrics: -
# Check the service is enabled
$ svcs node_exporter
STATE          STIME    FMRI
online         15:38:47 svc:/site/node_exporter:default

# Check it is listening
$ netstat -an | grep -Ei "tcp|local|9100|---"
TCP: IPv4
   Local Address        Remote Address    Swind  Send-Q Rwind  Recv-Q    State
-------------------- -------------------- ------ ------ ------ ------ -----------
      *.9100               *.*                 0      0 128000      0 LISTEN
10.15.31.20.9100     10.15.31.254.46192    64128      0 128872      0 ESTABLISHED

TCP: IPv6
   Local Address                     Remote Address                 Swind  Send-Q Rwind  Recv-Q    State      If
--------------------------------- --------------------------------- ------ ------ ------ ------ ----------- -----
      *.9100                            *.*                              0      0 128000      0 LISTEN

# Check it responds
curl 10.15.31.20:9100/metrics  | grep -i boot
# HELP node_boot_time_seconds Unix time of last boot, including microseconds.
# TYPE node_boot_time_seconds gauge
node_boot_time_seconds 1.59387695e+09
There is no uname section exposed in the node_exporter, hence using the node_boot_time_seconds metric instead.
Prometheus Targets
As Prometheus is already set up (see here), and matches on the prometheus tag, we should see this within the Prometheus targets straight away: -

The second target here is the illumos host.
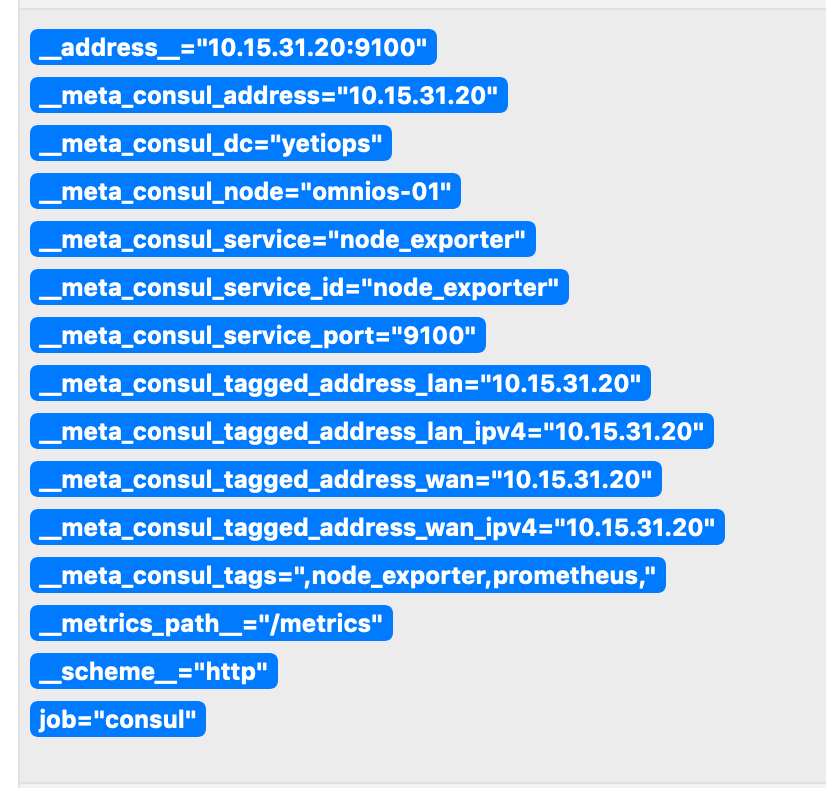
Above is the Metadata we receive from Consul about this host.
Grafana Dashboards
Looking at the node_exporter GitHub page, the following metrics are supported on Solaris/illumos: -
boottimecpucpufreqloadavgzfs
Because of this, you will find missing values on most dashboards (e.g. memory or network bandwidth utilization)
When using the existing Node Exporter dashboards with illumos, you’ll also notice that either your host is not listed, or that the results are confusing. For example, if we look at the Node Exporter Full dashboard, the host doesn’t appear: -
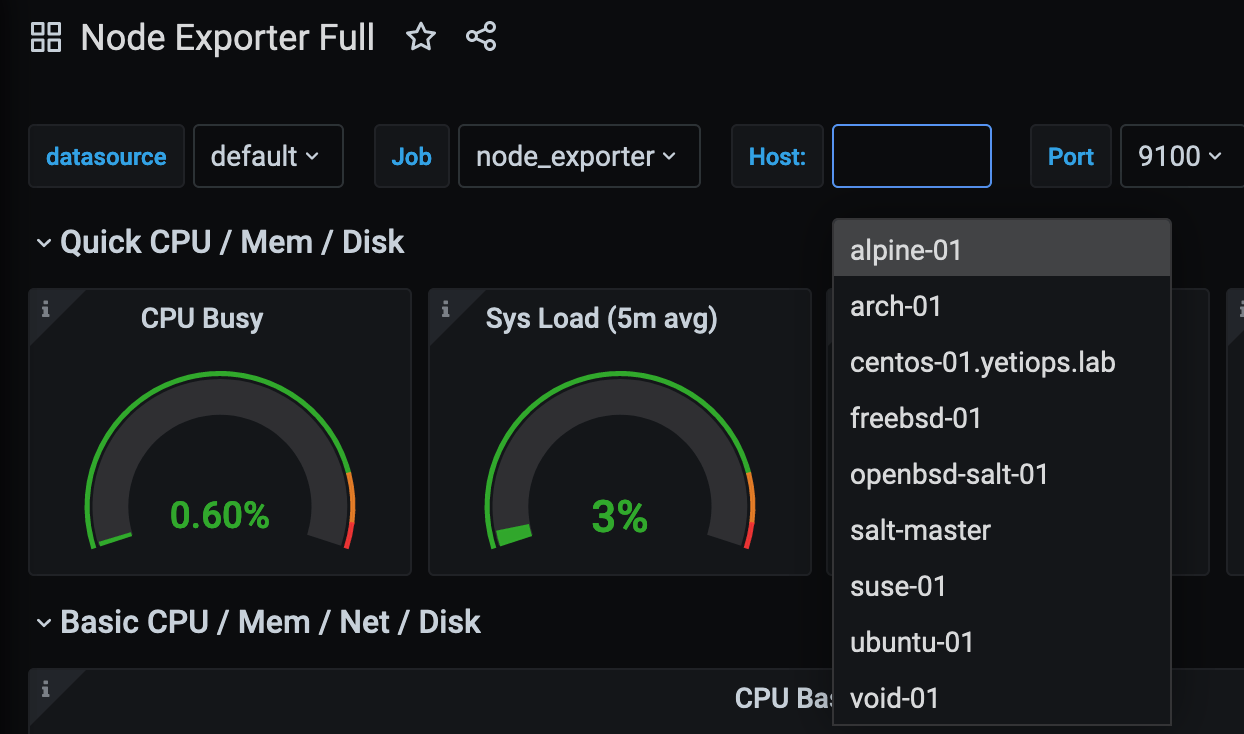
This is because the node_exporter binary on illumos/Solaris does not expose any uname metrics. The above dashboard relies upon uname metrics to differentiate between hosts: -

Looking at either the OpenBSD Server Overview dashboard or the Node Exporter FreeBSD dashboard, you will see results. However, they display graphs that are rather intriguing: -
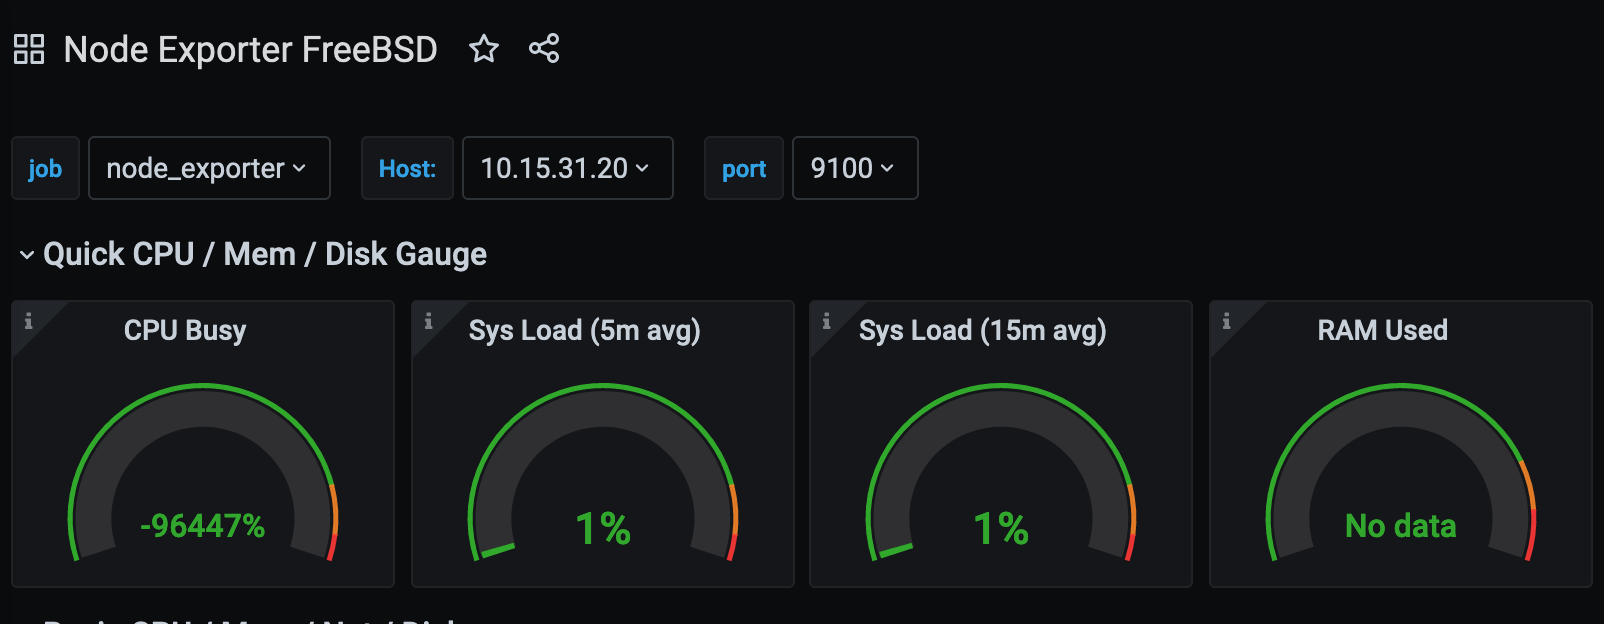
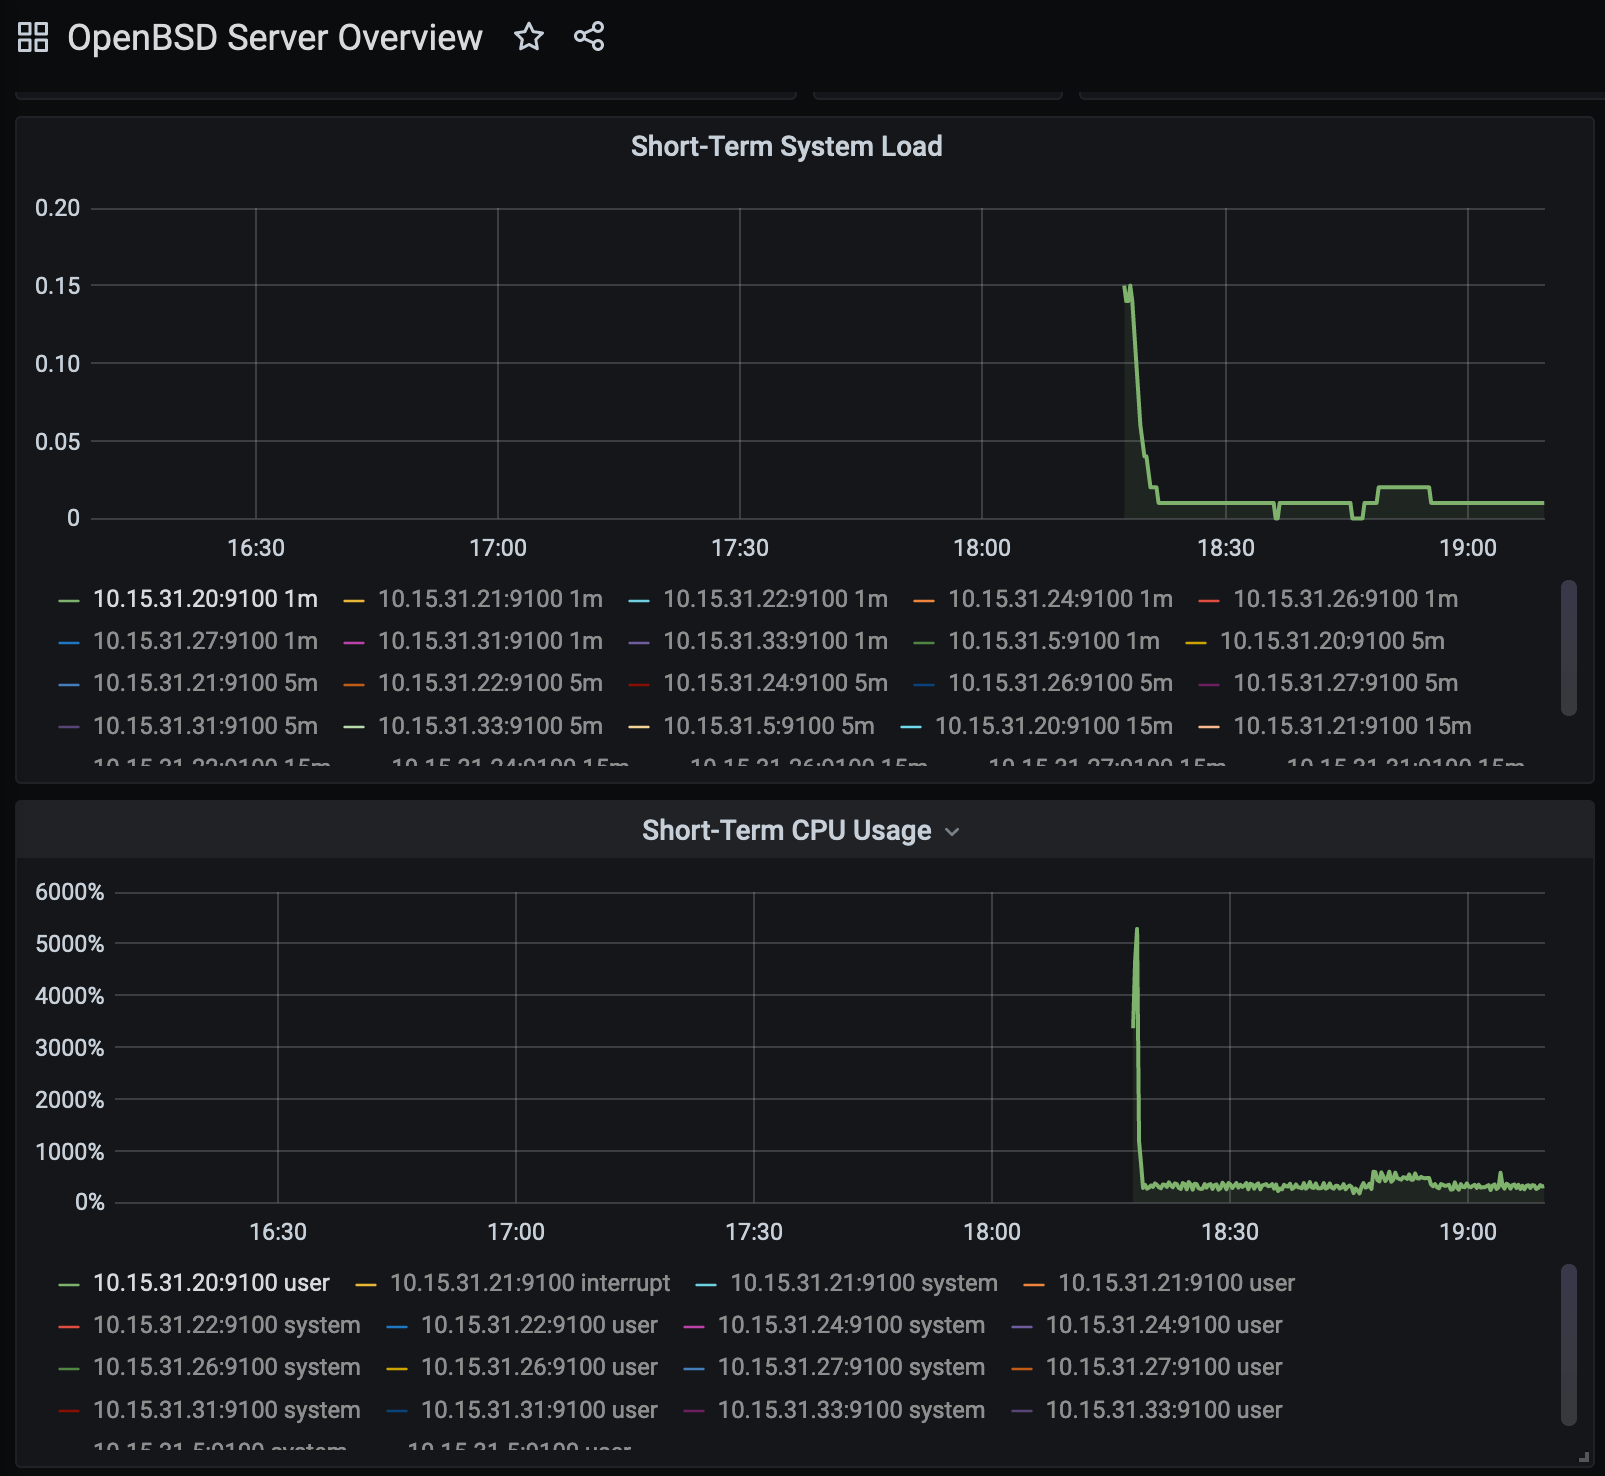
In both, we see CPU usage either in the negative thousands of percent (which is impossible) or the CPU being multiple of thousands of percent busy (which is very improbable). When compared to the load averages in both dashboards, it is safe to assume that the way these graphs are displaying the metrics does not match how a Solaris or illumos host would present them.
In the below, we can see what the CPU metric is returning across all of our systems: -
node_cpu_seconds_total{mode=~"user"}
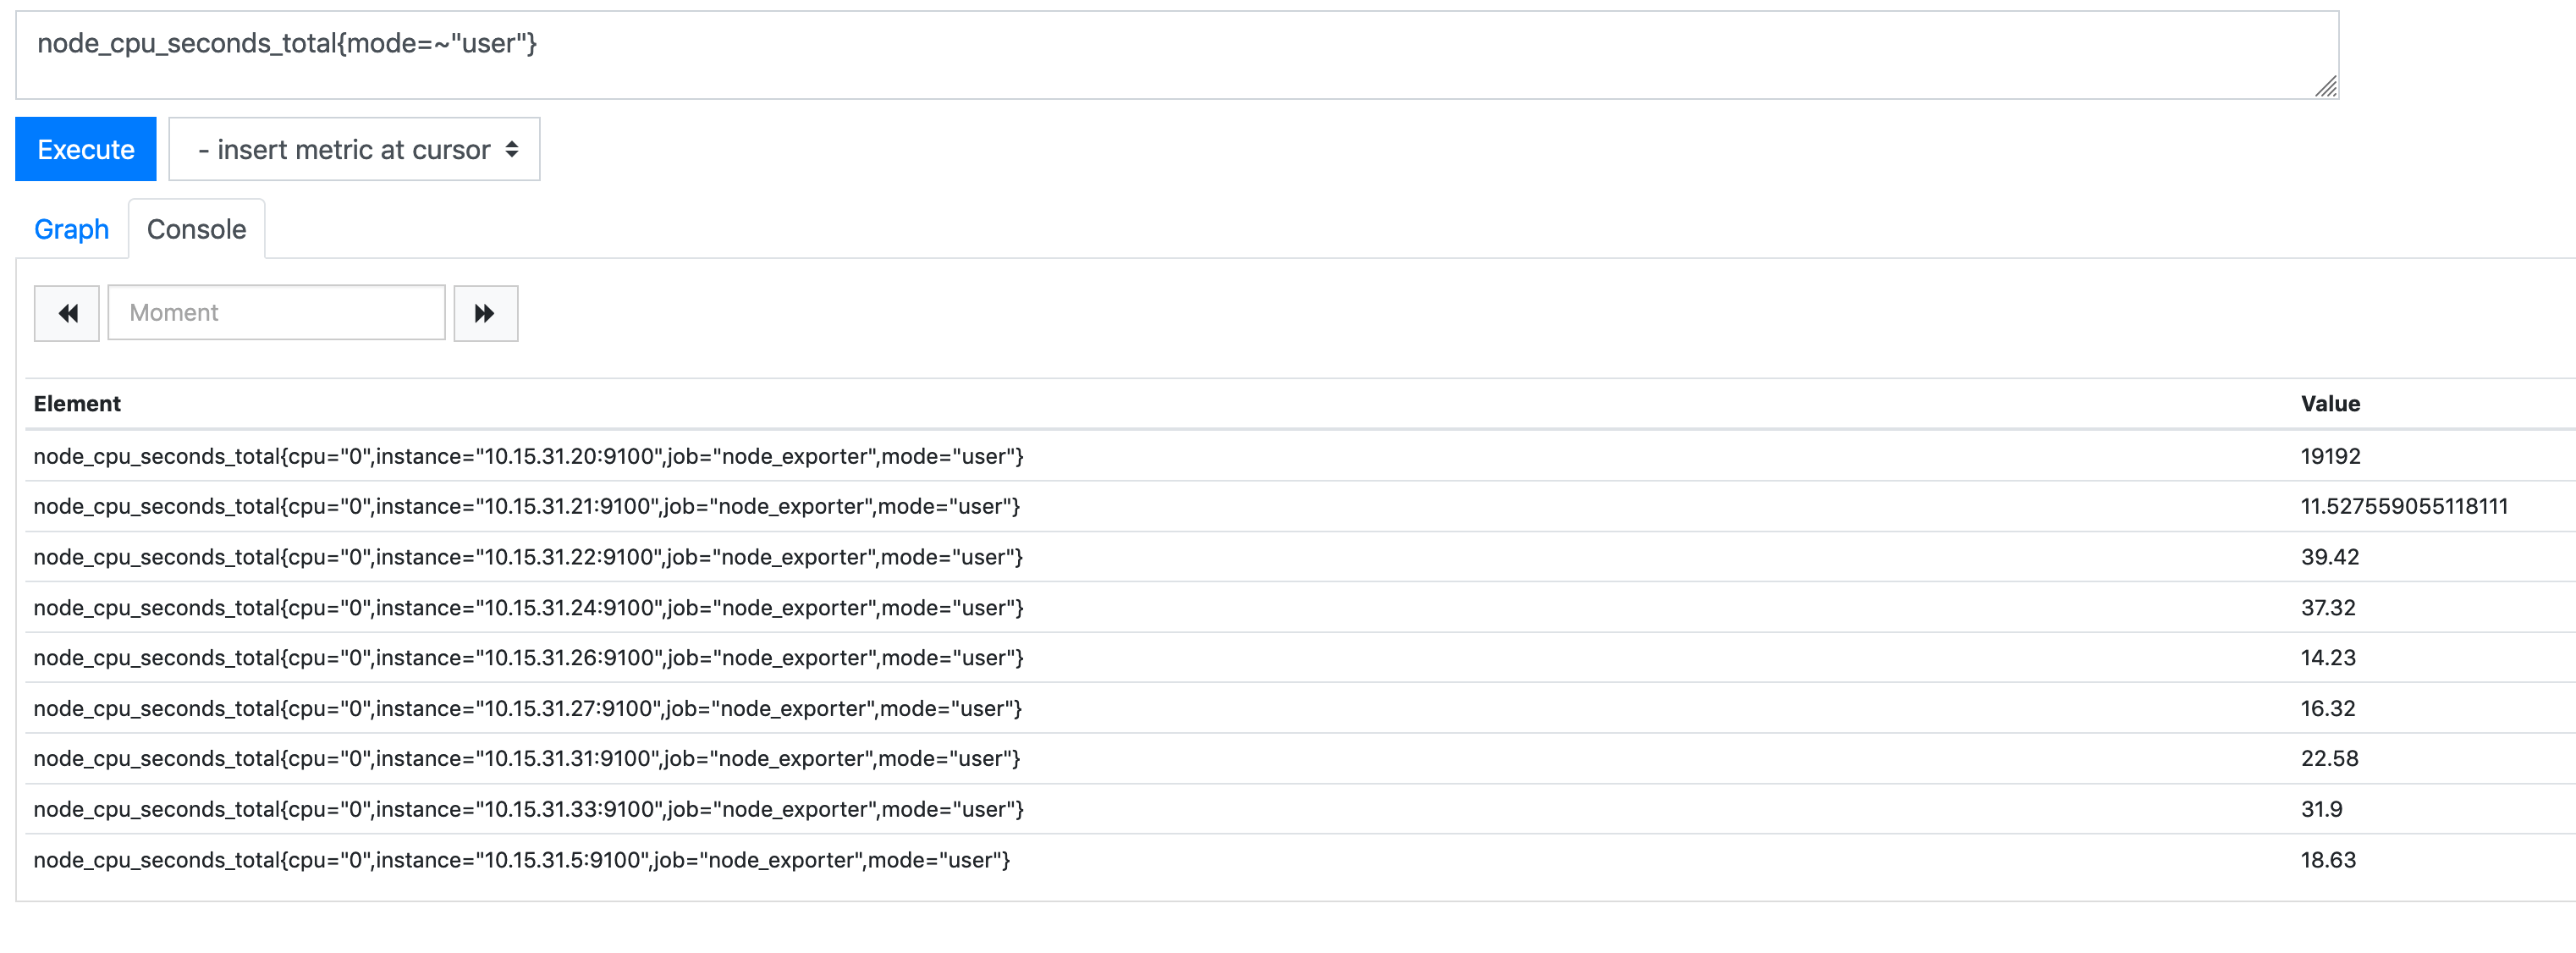
As you can see, the value for the illumos host (10.15.31.20) is significantly higher than the others (nearly 20000, when the others are between 10 and 40). If you use the following query instead, this gives something closer to reality: -
100 - (irate(node_cpu_seconds_total{mode="idle", instance="10.15.31.20:9100"}[5m]) / 10)
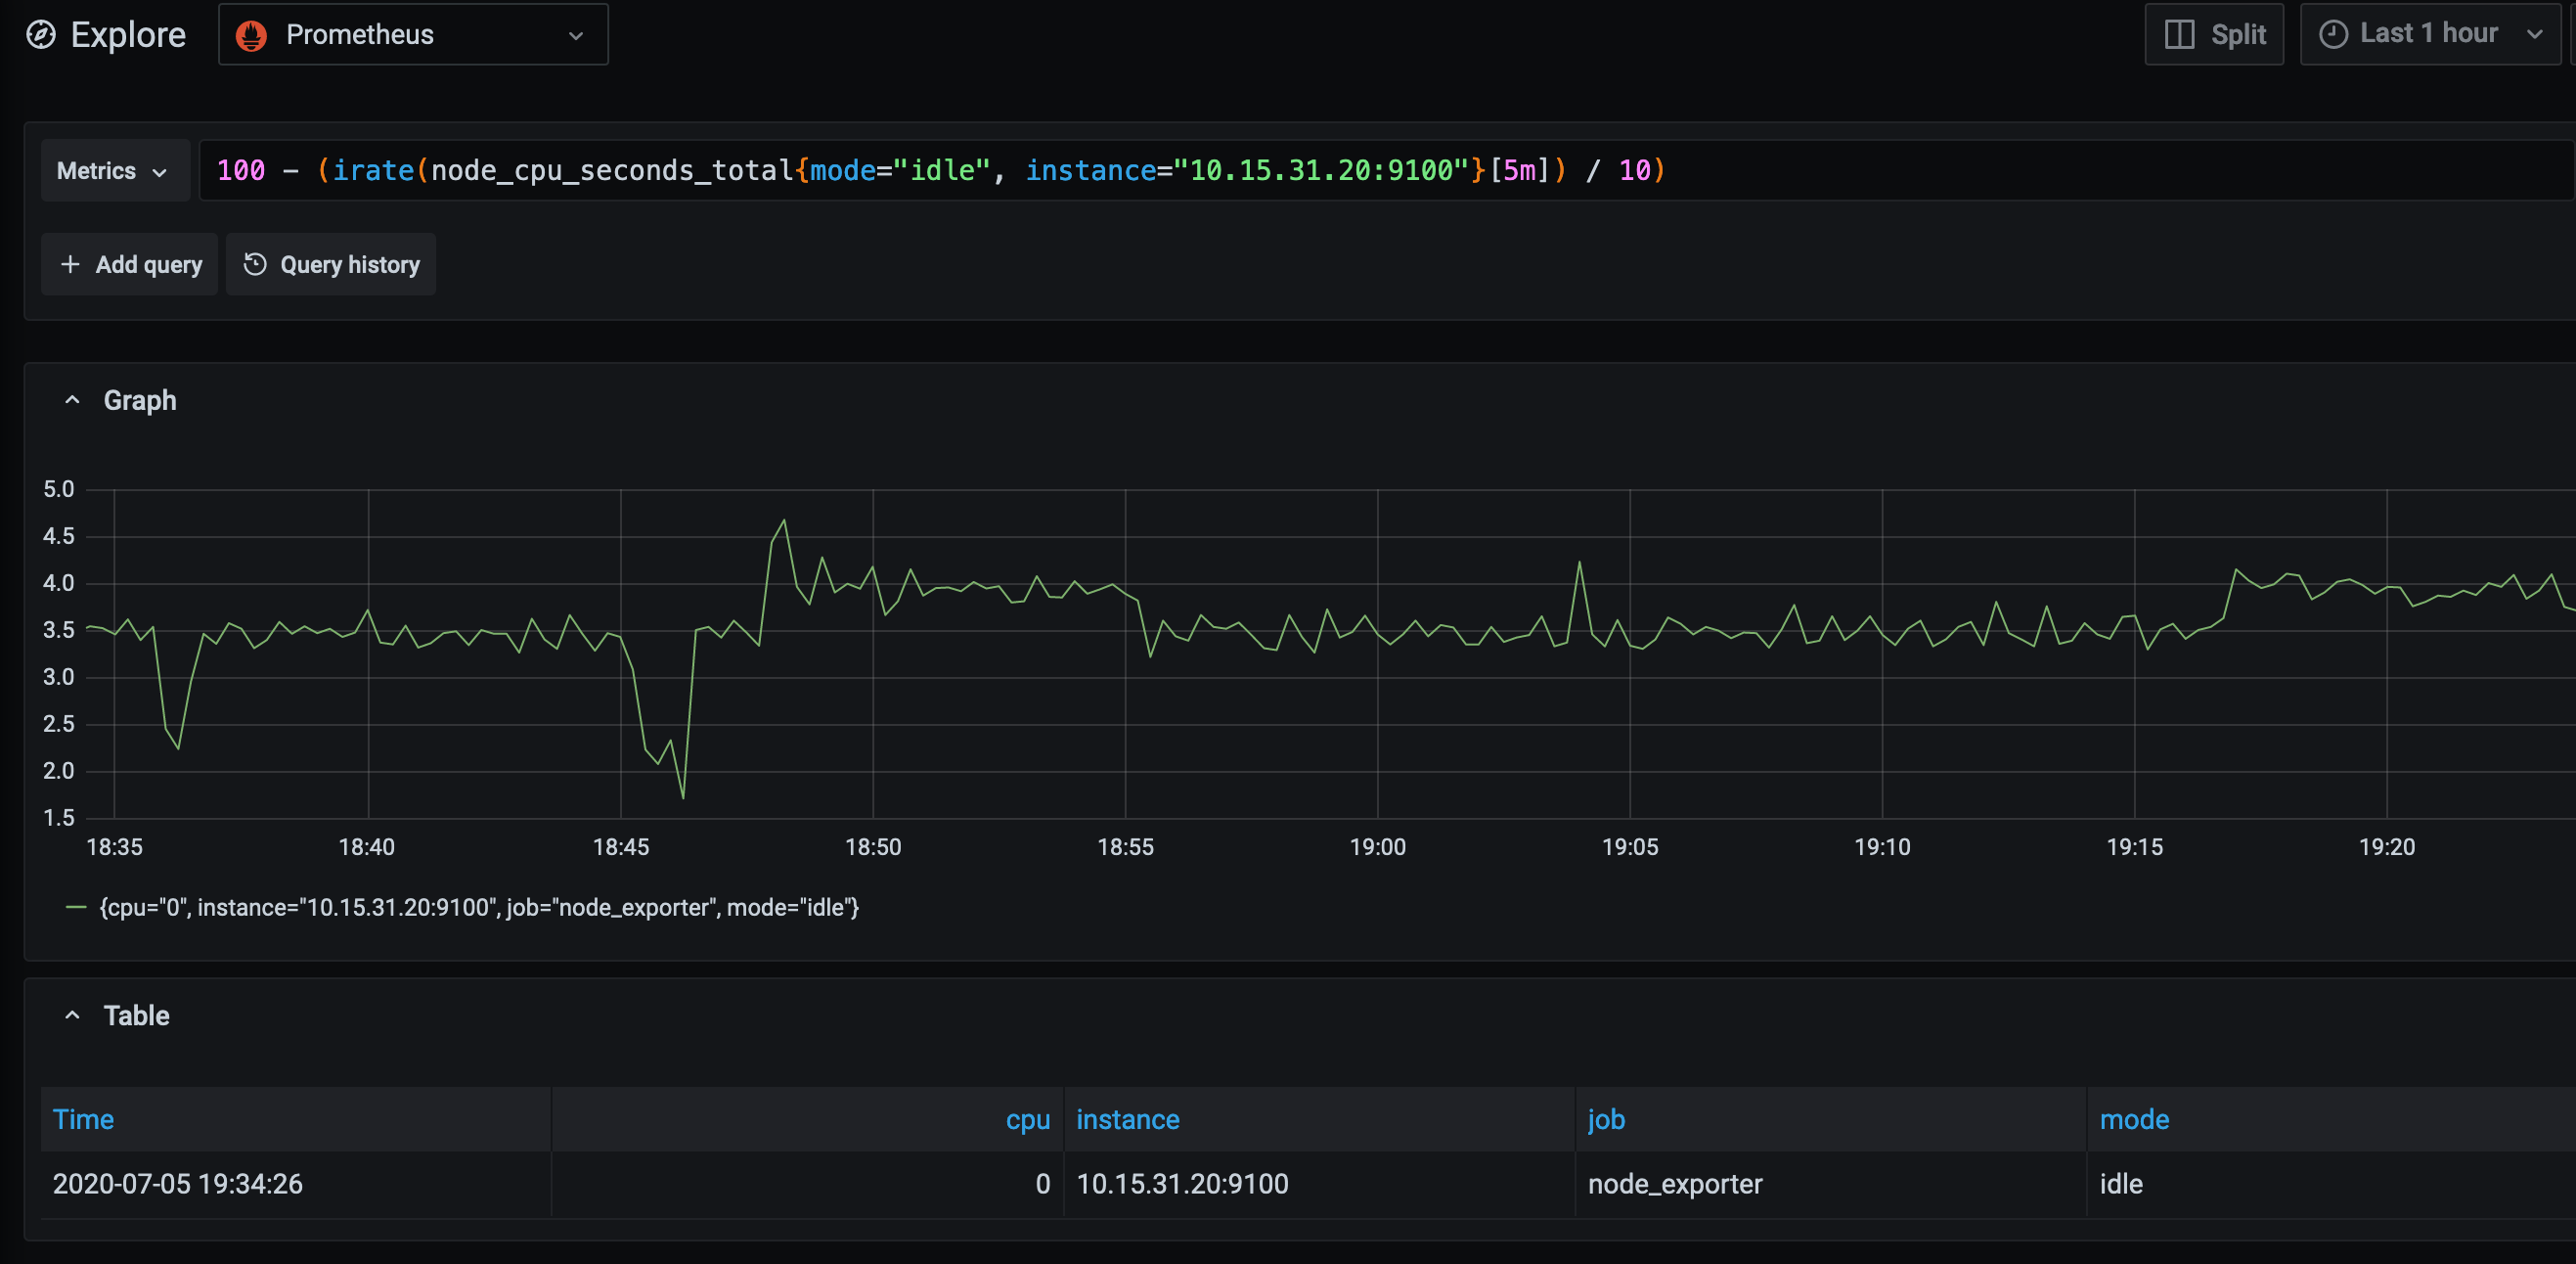
With this being the case, you will need to create your own dashboards if you choose to monitor illumos or Solaris hosts.
Summary
As I found when writing this post, the support for Solaris and illumos-derived operating systems is not on the same level as it is with Linux, Windows or even BSD. This does seem to be a product of the industry as a whole, as it is becoming rarer to see a machine or host running Solaris or illumos in a company’s infrastructure.
However for those who either still support Solaris, or those who use either Joyent’s Triton Compute (which Prometheus does provide Service Discovery for) or SmartOS, using SaltStack to manage them is still very viable, as well as deploying the monitoring agents too.
In the next post in this series, we will cover how you deploy SaltStack on a MacOS host, which will then deploy Consul and the Prometheus Node Exporter.
devops monitoring prometheus consul saltstack illumos
technical prometheus monitoring config management
3321 Words
2020-07-05 18:17 +0000