12 minutes
Prometheus - Auto-deploying Consul and Exporters using Saltstack Part 4: FreeBSD
This is the fourth part in my ongoing series on using SaltStack to deploy Consul and Prometheus Exporters, enabling Prometheus to discover machines and services to monitor. You can view the other posts in the series below: -
All of the states (as well as those for future posts, if you want a quick preview) are available in my Salt Lab repository.
Why FreeBSD?
FreeBSD is the most popular BSD-based operating system. Whereas OpenBSD’s primary goal is security, FreeBSD’s is on wider usability and better compatibility with newer hardware. This does mean that sometimes FreeBSD will include non-free/libre hardware modules for greater compatibility.
As FreeBSD (and other BSDs) is permissively licensed (using the BSD licenses rather than GPLv3 or similar), it is often used as a base for commercial operating systems that do not make their source code available. Examples of this are the Playstation 3 and 4 OS, Juniper’s JunOS, and even MacOS contains FreeBSD code (as part of the Darwin project).
A number of commercial companies contribute to the FreeBSD codebase, including iXsystems and a small, relatively unknown video streaming company called Netflix (tongue firmly in cheek 😝).
Configuring FreeBSD
The FreeBSD FAQ is a good place to start when discovering how to install and configure FreeBSD.
You can set a static IP for FreeBSD within the installer. To set it after install,edit /etc/rc.conf and add a line like the following: -
ifconfig_vtnet1="inet 10.15.31.21 netmask 255.255.255.0"
Bring up the additional interface using service netif restart.
Installing the Salt Minion
To install the Salt Minion in FreeBSD, you can use the pkg utility.
# Ensure the package exists
$ pkg search salt
p5-Crypt-Salt-0.01_1           Perl extension to generate a salt to be fed into crypt
p5-Crypt-SaltedHash-0.09       Perl extension to work with salted hashes
py27-salt-3001_1               Distributed remote execution and configuration management system
py37-salt-3001_1               Distributed remote execution and configuration management system
rubygem-hammer_cli_foreman_salt-0.0.5 SaltStack integration commands for Hammer CLI
rubygem-smart_proxy_salt-2.1.9 SaltStack Plug-In for Foreman's Smart Proxy

# Install the package
$ pkg install py37-salt-3001_1
After this, the Salt Minion will now be installed.
Configuring the Salt Minion
Salt has an included minion configuration file. We replace the contents with the below: -
master: salt-master.yetiops.lab
id: freebsd-01.yetiops.lab
nodename: freebsd-01
On most systems, this is in /etc/salt. On FreeBSD though, it is in /usr/local/etc/salt. This is because most user-installed utilities and applications in FreeBSD go into /usr/local, to separate them from the included applications and configuration.
Enable the Salt Minion and restart it using the following: -
# Enable the service
$ sysrc salt_minion_enable="YES"
salt_minion_enable: NO -> YES

# Restart the service
$ service salt_minion restart
Stopping salt_minion.
Waiting for PIDS: 866.
Starting salt_minion.
You should now see this host attempt to register with the Salt Master: -
$ sudo salt-key -L
Accepted Keys:
alpine-01.yetiops.lab
arch-01.yetiops.lab
centos-01.yetiops.lab
freebsd-01.yetiops.lab
openbsd-salt-01.yetiops.lab
salt-master.yetiops.lab
suse-01.yetiops.lab
ubuntu-01.yetiops.lab
void-01.yetiops.lab
win2019-01.yetiops.lab
Denied Keys:
Unaccepted Keys:
freebsd-01.yetiops.lab
Rejected Keys:
Accept the host with salt-key -a 'freebsd-01*'. Once this is done, you should now be able to manage the machine using Salt: -
$ salt 'freebsd*' test.ping
freebsd-01.yetiops.lab:
    True

$ salt 'freebsd*' grains.item os
freebsd-01.yetiops.lab:
    ----------
    os:
        FreeBSD
Salt States
We use three sets of states to deploy to FreeBSD. The first deploys Consul. The second deploys the Prometheus Node Exporter. The third installs the gstat_exporter which is used to query GEOM devices (primarily storage) on a FreeBSD host. This exporter is covered by the author here (including a provided dashboard).
Applying Salt States
Once you have configured the states detailed below, use one of the following options to deploy the changes to the FreeBSD machine: -
salt '*' state.highstatefrom the Salt server (to configure every machine and every state)salt 'freebsd*' state.highstatefrom the Salt server (to configure all machines with a name beginning withfreebsd*, applying all states)salt 'freebsd*' state.apply consulfrom the Salt server (to configure all machines with a name beginning withfreebsd*, applying only theconsulstate)salt-call state.highstatefrom a machine running the Salt agent (to configure just one machine with all states)salt-call state.apply consulfrom a machine running the Salt agent (to configure just one machine with only theconsulstate)
You can also use the salt -C option to apply based upon grains, pillars or other types of matches. For example, to apply to all machines running an FreeBSD kernel, you could run salt -C 'G@kernel:FreeBSD' state.highstate.
Consul - Deployment
The following Salt state is used to deploy Consul onto a FreeBSD host: -
/srv/salt/states/consul/freebsd.sls
consul_package:
  pkg.installed:
  - pkgs:
    - consul

/opt/consul:
  file.directory:
    - user: consul
    - group: consul
    - mode: 755
    - makedirs: True

/usr/local/etc/consul.d:
  file.directory:
    - user: consul
    - group: consul
    - mode: 755
    - makedirs: True

/usr/local/etc/consul.d/consul.hcl:
  file.managed:
{% if pillar['consul'] is defined %}
{% if pillar['consul']['server'] is defined %}
    - source: salt://consul/server/files/consul.hcl.j2
{% else %}
    - source: salt://consul/client/files/consul.hcl.j2
{% endif %}
{% endif %}
    - user: consul
    - group: consul
    - mode: 0640
    - template: jinja

consul_service:
  service.running:
  - name: consul
  - enable: True
  - reload: True
  - watch:
    - file: /usr/local/etc/consul.d/consul.hcl

{% if pillar['consul'] is defined %}
{% if pillar['consul']['prometheus_services'] is defined %}
{% for service in pillar['consul']['prometheus_services'] %}
/usr/local/etc/consul.d/{{ service }}.hcl:
  file.managed:
    - source: salt://consul/services/files/{{ service }}.hcl
    - user: consul
    - group: consul
    - mode: 0640
    - template: jinja

consul_reload_{{ service }}:
  cmd.run:
    - name: consul reload
    - watch:
      - file: /usr/local/etc/consul.d/{{ service }}.hcl
{% endfor %}
{% endif %}
{% endif %}
If you compare this to the OpenBSD Consul Deployment, they are almost identical. The only differences are: -
- FreeBSD does not prefix system users and groups with an underscore (e.g.
_consulrather thanconsul) - The configuration paths are all prefixed with
/usr/local(e.g./usr/local/etc/consulrather than/etc/consul)
This state is applied to FreeBSD machines as such: -
base:
  'G@init:systemd and G@kernel:Linux':
    - match: compound
    - consul
    - exporters.node_exporter.systemd

  'os:Alpine':
    - match: grain
    - consul.alpine
    - exporters.node_exporter.alpine

  'os:Void':
    - match: grain
    - consul.void
    - exporters.node_exporter.void

  'kernel:OpenBSD':
    - match: grain
    - consul.openbsd
    - exporters.node_exporter.bsd

  'kernel:FreeBSD':
    - match: grain
    - consul.freebsd

  'kernel:Windows':
    - match: grain
    - consul.windows
    - exporters.windows_exporter.win_exporter
    - exporters.windows_exporter.windows_exporter
We match the kernel grain, ensuring the value is FreeBSD: -
$ salt 'freebsd*' grains.item kernel
freebsd-01.yetiops.lab:
    ----------
    kernel:
        FreeBSD
Pillars
We use the consul.sls and the consul-dc.sls pillars as we do with Linux and OpenBSD.
consul.sls
consul:
  data_dir: /opt/consul
  prometheus_services:
  - node_exporter
consul-dc.sls
consul:
  dc: yetiops
  enc_key: ###CONSUL_KEY###
  servers:
  - salt-master.yetiops.lab
We also specify an additional pillar, to add the additional exporter: -
consul-freebsd.sls
consul:
  prometheus_services:
    - gstat_exporter
    - node_exporter
We have specified the node_exporter twice. This is because the prometheus_services list in this pillar does not merge with the list in the consul.sls file, taking precedence over it instead. The Consul service file for the gstat_exporter looks like the below: -
/srv/states/consul/services/files/gstat_exporter.hcl
{"service":
  {"name": "gstat_exporter",
   "tags": ["gstat_exporter", "prometheus"],
   "port": 9248
  }
}
We use the prometheus tag as before (to ensure that it is discovered by Prometheus) and also the gstat_exporter tag. If we want to use a different Prometheus job (to apply different scrape intervals or relabelling), we could use this tag to match against.
These pillars reside in /srv/salt/pillars/consul. They are applied as such: -
base:
  '*':
    - consul.consul-dc

  'G@kernel:Linux or G@kernel:OpenBSD or G@kernel:FreeBSD':
    - match: compound
    - consul.consul

  'kernel:FreeBSD':
    - match: grain
    - consul.consul-freebsd

  'kernel:Windows':
    - match: grain
    - consul.consul-client-win

  'salt-master*':
    - consul.consul-server
To match FreeBSD, we add the G@kernel:FreeBSD part to our original match statement (to include the standard consul.consul pillar) as well an additional section to add the FreeBSD-specific exporters.
Consul - Verification
We can verify that Consul is working with the below: -
$ consul members
Node                         Address           Status  Type    Build  Protocol  DC       Segment
salt-master                  10.15.31.5:8301   alive   server  1.7.3  2         yetiops  <all>
alpine-01                    10.15.31.27:8301  alive   client  1.7.3  2         yetiops  <default>
arch-01                      10.15.31.26:8301  alive   client  1.7.3  2         yetiops  <default>
centos-01.yetiops.lab        10.15.31.24:8301  alive   client  1.7.3  2         yetiops  <default>
freebsd-01.yetiops.lab       10.15.31.21:8301  alive   client  1.7.2  2         yetiops  <default>
openbsd-salt-01.yetiops.lab  10.15.31.23:8301  alive   client  1.7.2  2         yetiops  <default>
suse-01                      10.15.31.22:8301  alive   client  1.7.3  2         yetiops  <default>
ubuntu-01                    10.15.31.33:8301  alive   client  1.7.3  2         yetiops  <default>
void-01                      10.15.31.31:8301  alive   client  1.7.2  2         yetiops  <default>
win2019-01                   10.15.31.25:8301  alive   client  1.7.2  2         yetiops  <default>

$ consul catalog nodes -service node_exporter
Node                         ID        Address      DC
alpine-01                    e59eb6fc  10.15.31.27  yetiops
arch-01                      97c67201  10.15.31.26  yetiops
centos-01.yetiops.lab        78ac8405  10.15.31.24  yetiops
freebsd-01.yetiops.lab       3e7b0ce8  10.15.31.21  yetiops
openbsd-salt-01.yetiops.lab  c87bfa18  10.15.31.23  yetiops
salt-master                  344fb6f2  10.15.31.5   yetiops
suse-01                      d2fdd88a  10.15.31.22  yetiops
ubuntu-01                    4544c7ff  10.15.31.33  yetiops
void-01                      e99c7e3c  10.15.31.31  yetiops
Node Exporter - Deployment
Now that Consul is up and running, we will install the Prometheus Node Exporter.
States
The following Salt state is used to deploy the Prometheus Node Exporter onto a FreeBSD host: -
/srv/salt/states/exporters/node_exporter/bsd.sls
node_exporter_package:
  pkg.installed:
    - pkgs:
      - node_exporter

node_exporter_service:
  service.running:
    - name: node_exporter
    - enable: true
This state is the same as we use for OpenBSD. While the hosts themselves use a different package manager and init systems, Salt serves as an abstraction to this, meaning we do not need to configure states per package manager in use.
We apply the state with the following: -
base:
  'G@init:systemd and G@kernel:Linux':
    - match: compound
    - consul
    - exporters.node_exporter.systemd

  'os:Alpine':
    - match: grain
    - consul.alpine
    - exporters.node_exporter.alpine

  'os:Void':
    - match: grain
    - consul.void
    - exporters.node_exporter.void

  'kernel:OpenBSD':
    - match: grain
    - consul.openbsd
    - exporters.node_exporter.bsd

  'kernel:FreeBSD':
    - match: grain
    - consul.freebsd
    - exporters.node_exporter.bsd

  'kernel:Windows':
    - match: grain
    - consul.windows
    - exporters.windows_exporter.win_exporter
    - exporters.windows_exporter.windows_exporter
Pillars
There are no pillars in this lab specific to the Node Exporter.
Node Exporter - Verification
After this, we should be able to see the node_exporter running and producing metrics: -
# Check the service is enabled
$ service node_exporter status
node_exporter is running as pid 873.
$

# Check it is listening
$ netstat -an | grep -i 9100
tcp4       0      0 10.15.31.21.9100       10.15.31.254.45882     ESTABLISHED
tcp46      0      0 *.9100                 *.*                    LISTEN

# Check it responds
$ curl 10.15.31.21:9100/metrics | grep -i uname
node_uname_info{domainname="yetiops.lab",machine="amd64",nodename="freebsd-01",release="12.1-RELEASE",sysname="FreeBSD",version="FreeBSD 12.1-RELEASE r354233 GENERIC "} 1
All looks good!
Gstat Exporter - Deployment
As part of this, we are also adding an additional exporter. The creator of the Gstat Exporter created Ansible Playbooks to deploy Gstat Exporter, which are quite straightforward to adapt to Salt state files.
The only change I have made is creating an rc.d script rather than using supervisor. This cuts down on required dependencies.
States
The following Salt state is used to deploy the Gstat Exporter on a FreeBSD host: -
/srv/salt/states/exporters/gstat_exporter/freebsd.sls
gstat_exporter_deps:
  pkg.installed:
    - pkgs:
      - py37-pip
      - py37-setuptools
      - py37-virtualenv
      - git

gstat_git_repo:
  git.cloned:
    - name: https://github.com/tykling/gstat_exporter
    - target: /usr/local/gstat_exporter

gstat_requirements:
  virtualenv.managed:
    - name: /usr/local/gstat_exporter/venv
    - requirements: /usr/local/gstat_exporter/requirements.txt

/usr/local/etc/rc.d/gstat_exporter:
  file.managed:
    - source: salt://exporters/gstat_exporter/files/gstat_exporter-rcd
    - mode: 0755

gstat_exporter:
  service.running:
    - enable: true
First, we install our dependencies (Python3’s PIP package manager, Python3 setuptools, Python3 Virtualenvs and Git).
After this, we clone the exporter’s GitHub repository into /usr/local/gstat_exporter.
Next, we use the virtualenv.managed state to create a Python virtualenv. A virtualenv (or virtual environment) is a localised installation of Python, with its own packages and requirements installed. This means that you do not create conflicts with system packages, or version conflicts with other Python applications on your system. This also installs the Python3 modules that are specified in the repository’s requirements.txt file inside the virtual environment.
We then add an rc.d configuration file, which is used to start and enable the gstat_exporter at runtime. The contents of this file are: -
/srv/salt/states/exporters/gstat_exporter/files/gstat_exporter-rcd
#!/bin/sh
#
# PROVIDE: gstat_exporter
# REQUIRE: LOGIN NETWORKING

. /etc/rc.subr

name="gstat_exporter"
rcvar=${name}_enable

: "${gstat_exporter_enable:="NO"}"

command_interpreter="/usr/local/gstat_exporter/venv/bin/python"
command="/usr/local/gstat_exporter/gstat_exporter.py"
start_cmd="/usr/sbin/daemon $command_interpreter $command"
pidfile="/var/run${name}.pid"

load_rc_config ${name}
run_rc_command "$1"
This file uses our virtualenv-installed Python binary to run the gstat_exporter.py application. We use the /usr/sbin/daemon command to ensure that it runs continuously in the background.
For more information on creating rc.d configuration scripts, see here.
Finally, we enable the gstat_exporter service, and run it.
This state is applied with the following: -
base:
  'G@init:systemd and G@kernel:Linux':
    - match: compound
    - consul
    - exporters.node_exporter.systemd

  'os:Alpine':
    - match: grain
    - consul.alpine
    - exporters.node_exporter.alpine

  'os:Void':
    - match: grain
    - consul.void
    - exporters.node_exporter.void

  'kernel:OpenBSD':
    - match: grain
    - consul.openbsd
    - exporters.node_exporter.bsd

  'kernel:FreeBSD':
    - match: grain
    - consul.freebsd
    - exporters.node_exporter.bsd
    - exporters.gstat_exporter.freebsd

  'kernel:Windows':
    - match: grain
    - consul.windows
    - exporters.windows_exporter.win_exporter
    - exporters.windows_exporter.windows_exporter
Pillars
There are no pillars in this lab specific to the Gstat Exporter.
Gstat Exporter - Verification
After this, we should be able to see the gstat_exporter running and producing metrics: -
$ ps aux | grep -i gstat
root    880   0.0  2.1  33076 21280  -  Ss   18:34    0:01.74 /usr/local/gstat_exporter/venv/bin/python /usr/local/gstat_exporter/gstat_exporter.py (python3.7)

$ netstat -an | grep -i 9248
tcp4       0      0 10.15.31.21.9248       10.15.31.254.42722     TIME_WAIT
tcp4       0      0 10.15.31.21.9248       10.15.31.254.42718     TIME_WAIT
tcp4       0      0 10.15.31.21.9248       10.15.31.254.42708     TIME_WAIT
tcp4       0      0 *.9248                 *.*                    LISTEN

$ curl 10.15.31.21:9248/metrics | grep -i up
gstat_up 1.0
All looks good!
Prometheus Targets
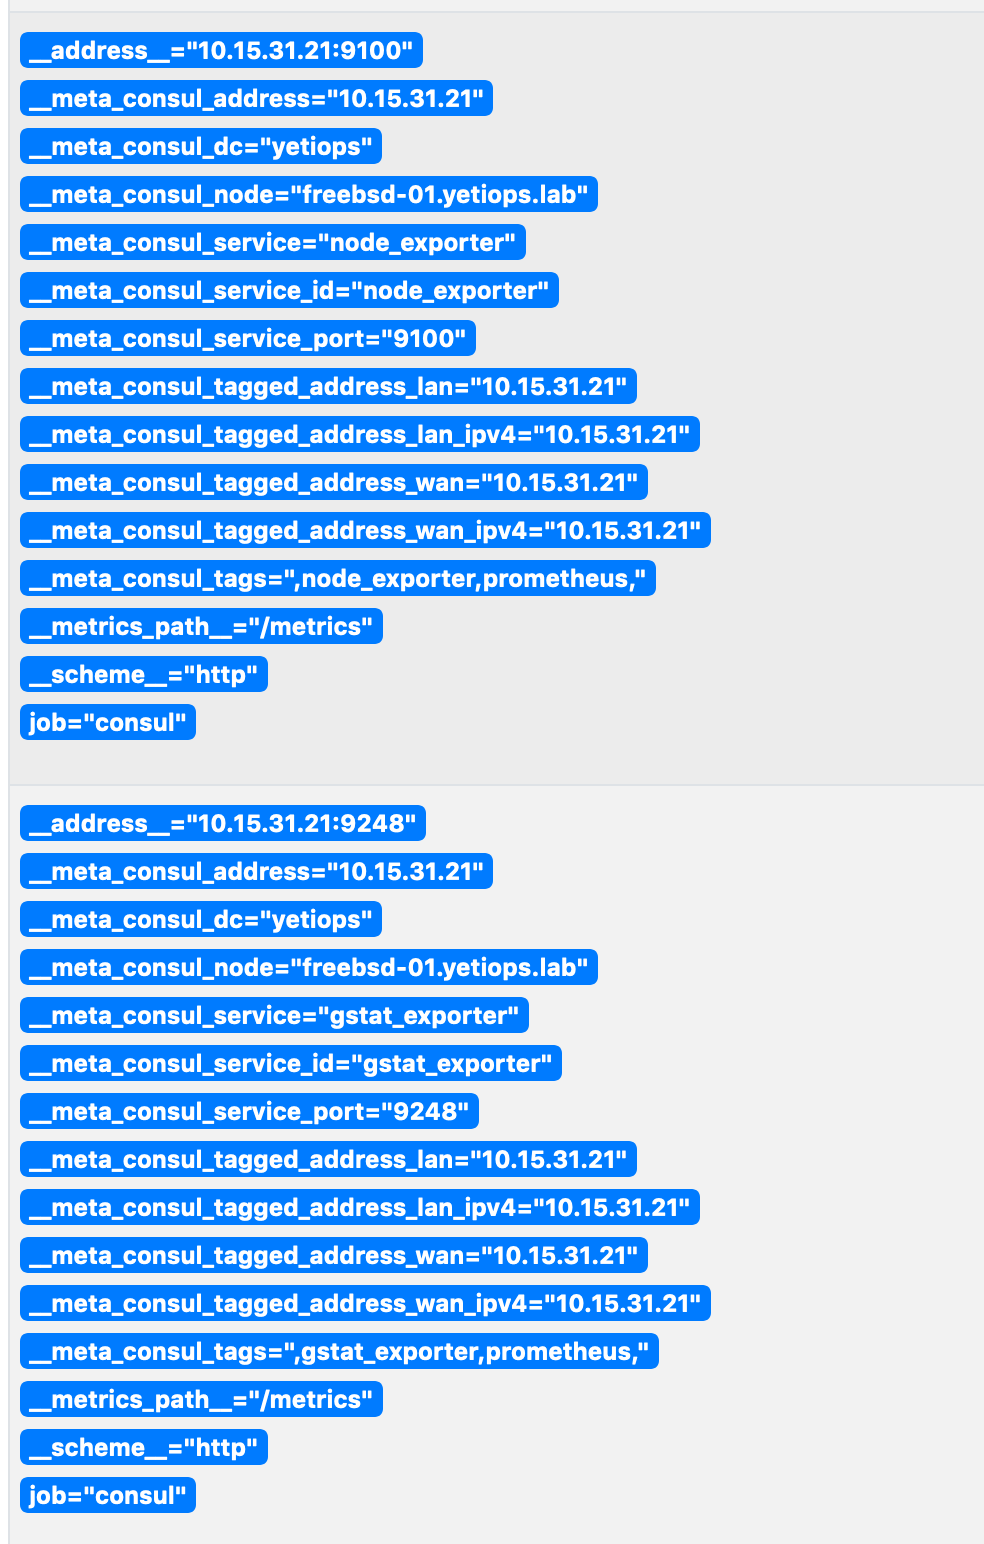
As Prometheus is already set up (see here), and matches on the prometheus tag, we should see this within the Prometheus targets straight away: -

As you can see, both exporters (node_exporter and gstat_exporter) appear here.

Above is the Metadata we receive from Consul about this host. It appears twice, because we have two services, and therefore two sets of unique metadata (despite many duplicate labels).
Grafana
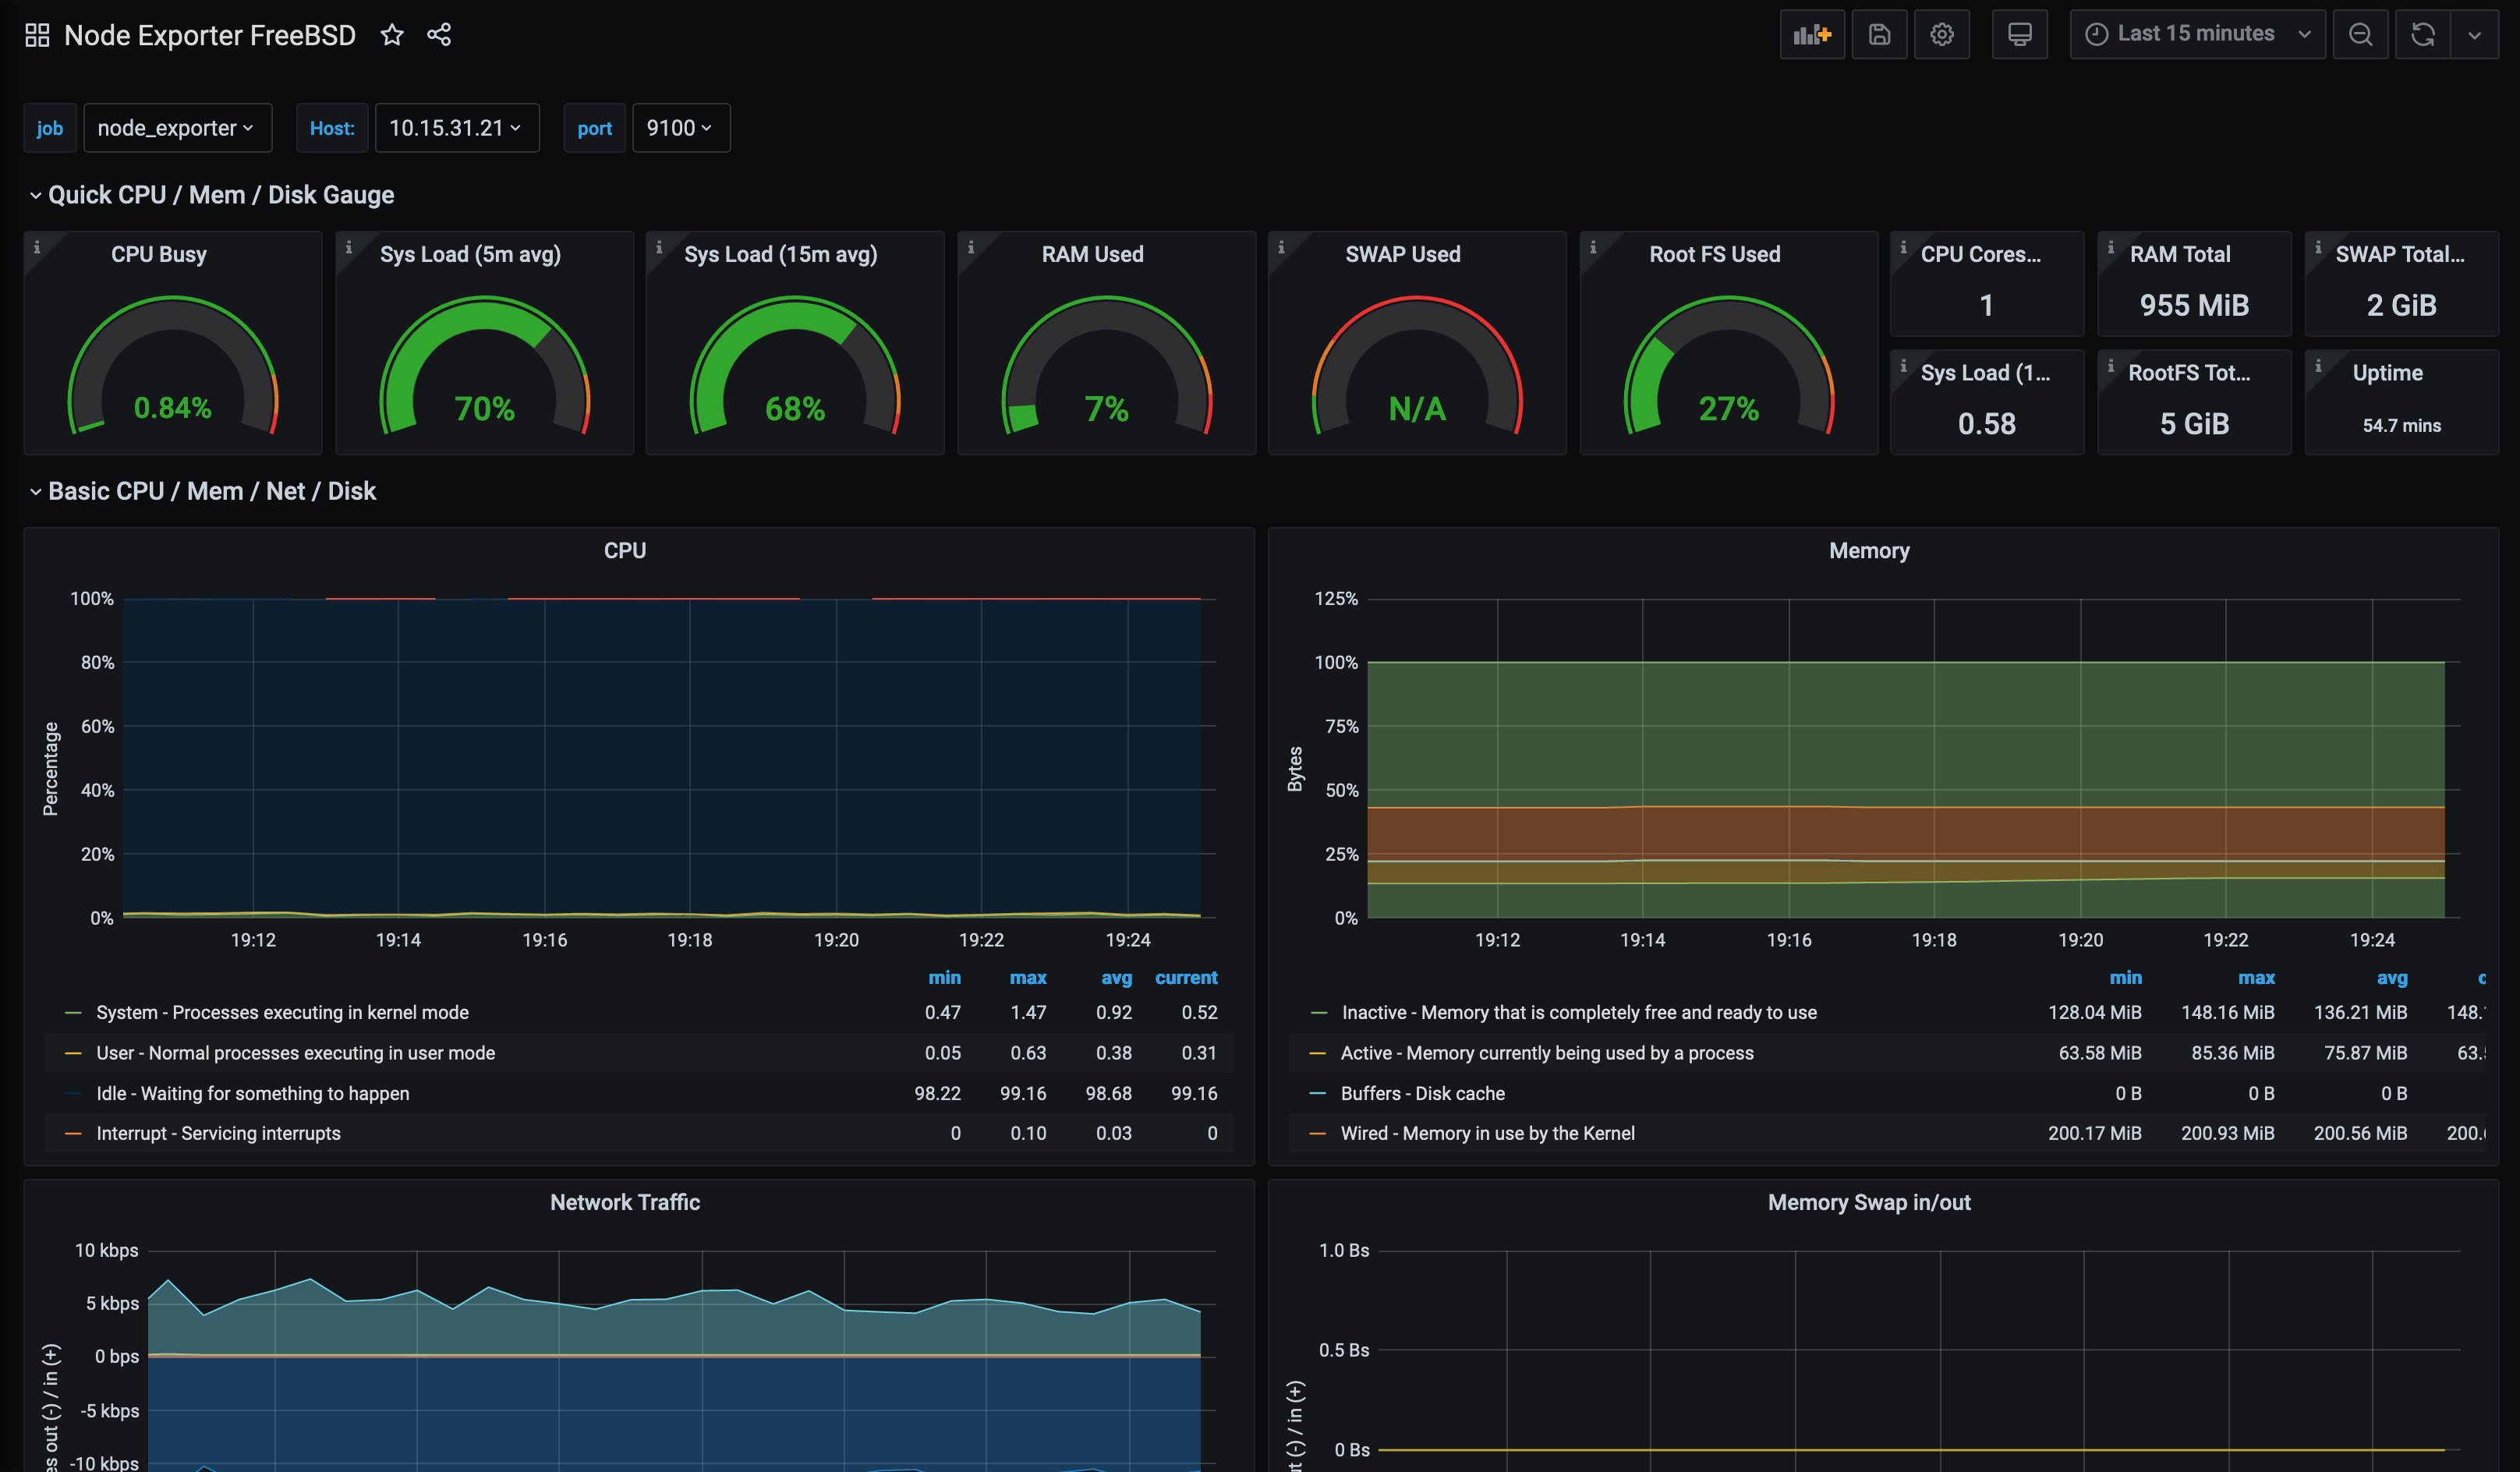
As with OpenBSD, load in FreeBSD is a measure of CPU usage only. Linux’s load calculation is based upon many other factors, as noted in Brendan Gregg’s Linux Load Averages article.
With this being the case, using a standard Node Exporter dashboard would not be accurate. As mentioned in the OpenBSD post though, there is already a Node Exporter dashboard for FreeBSD: -

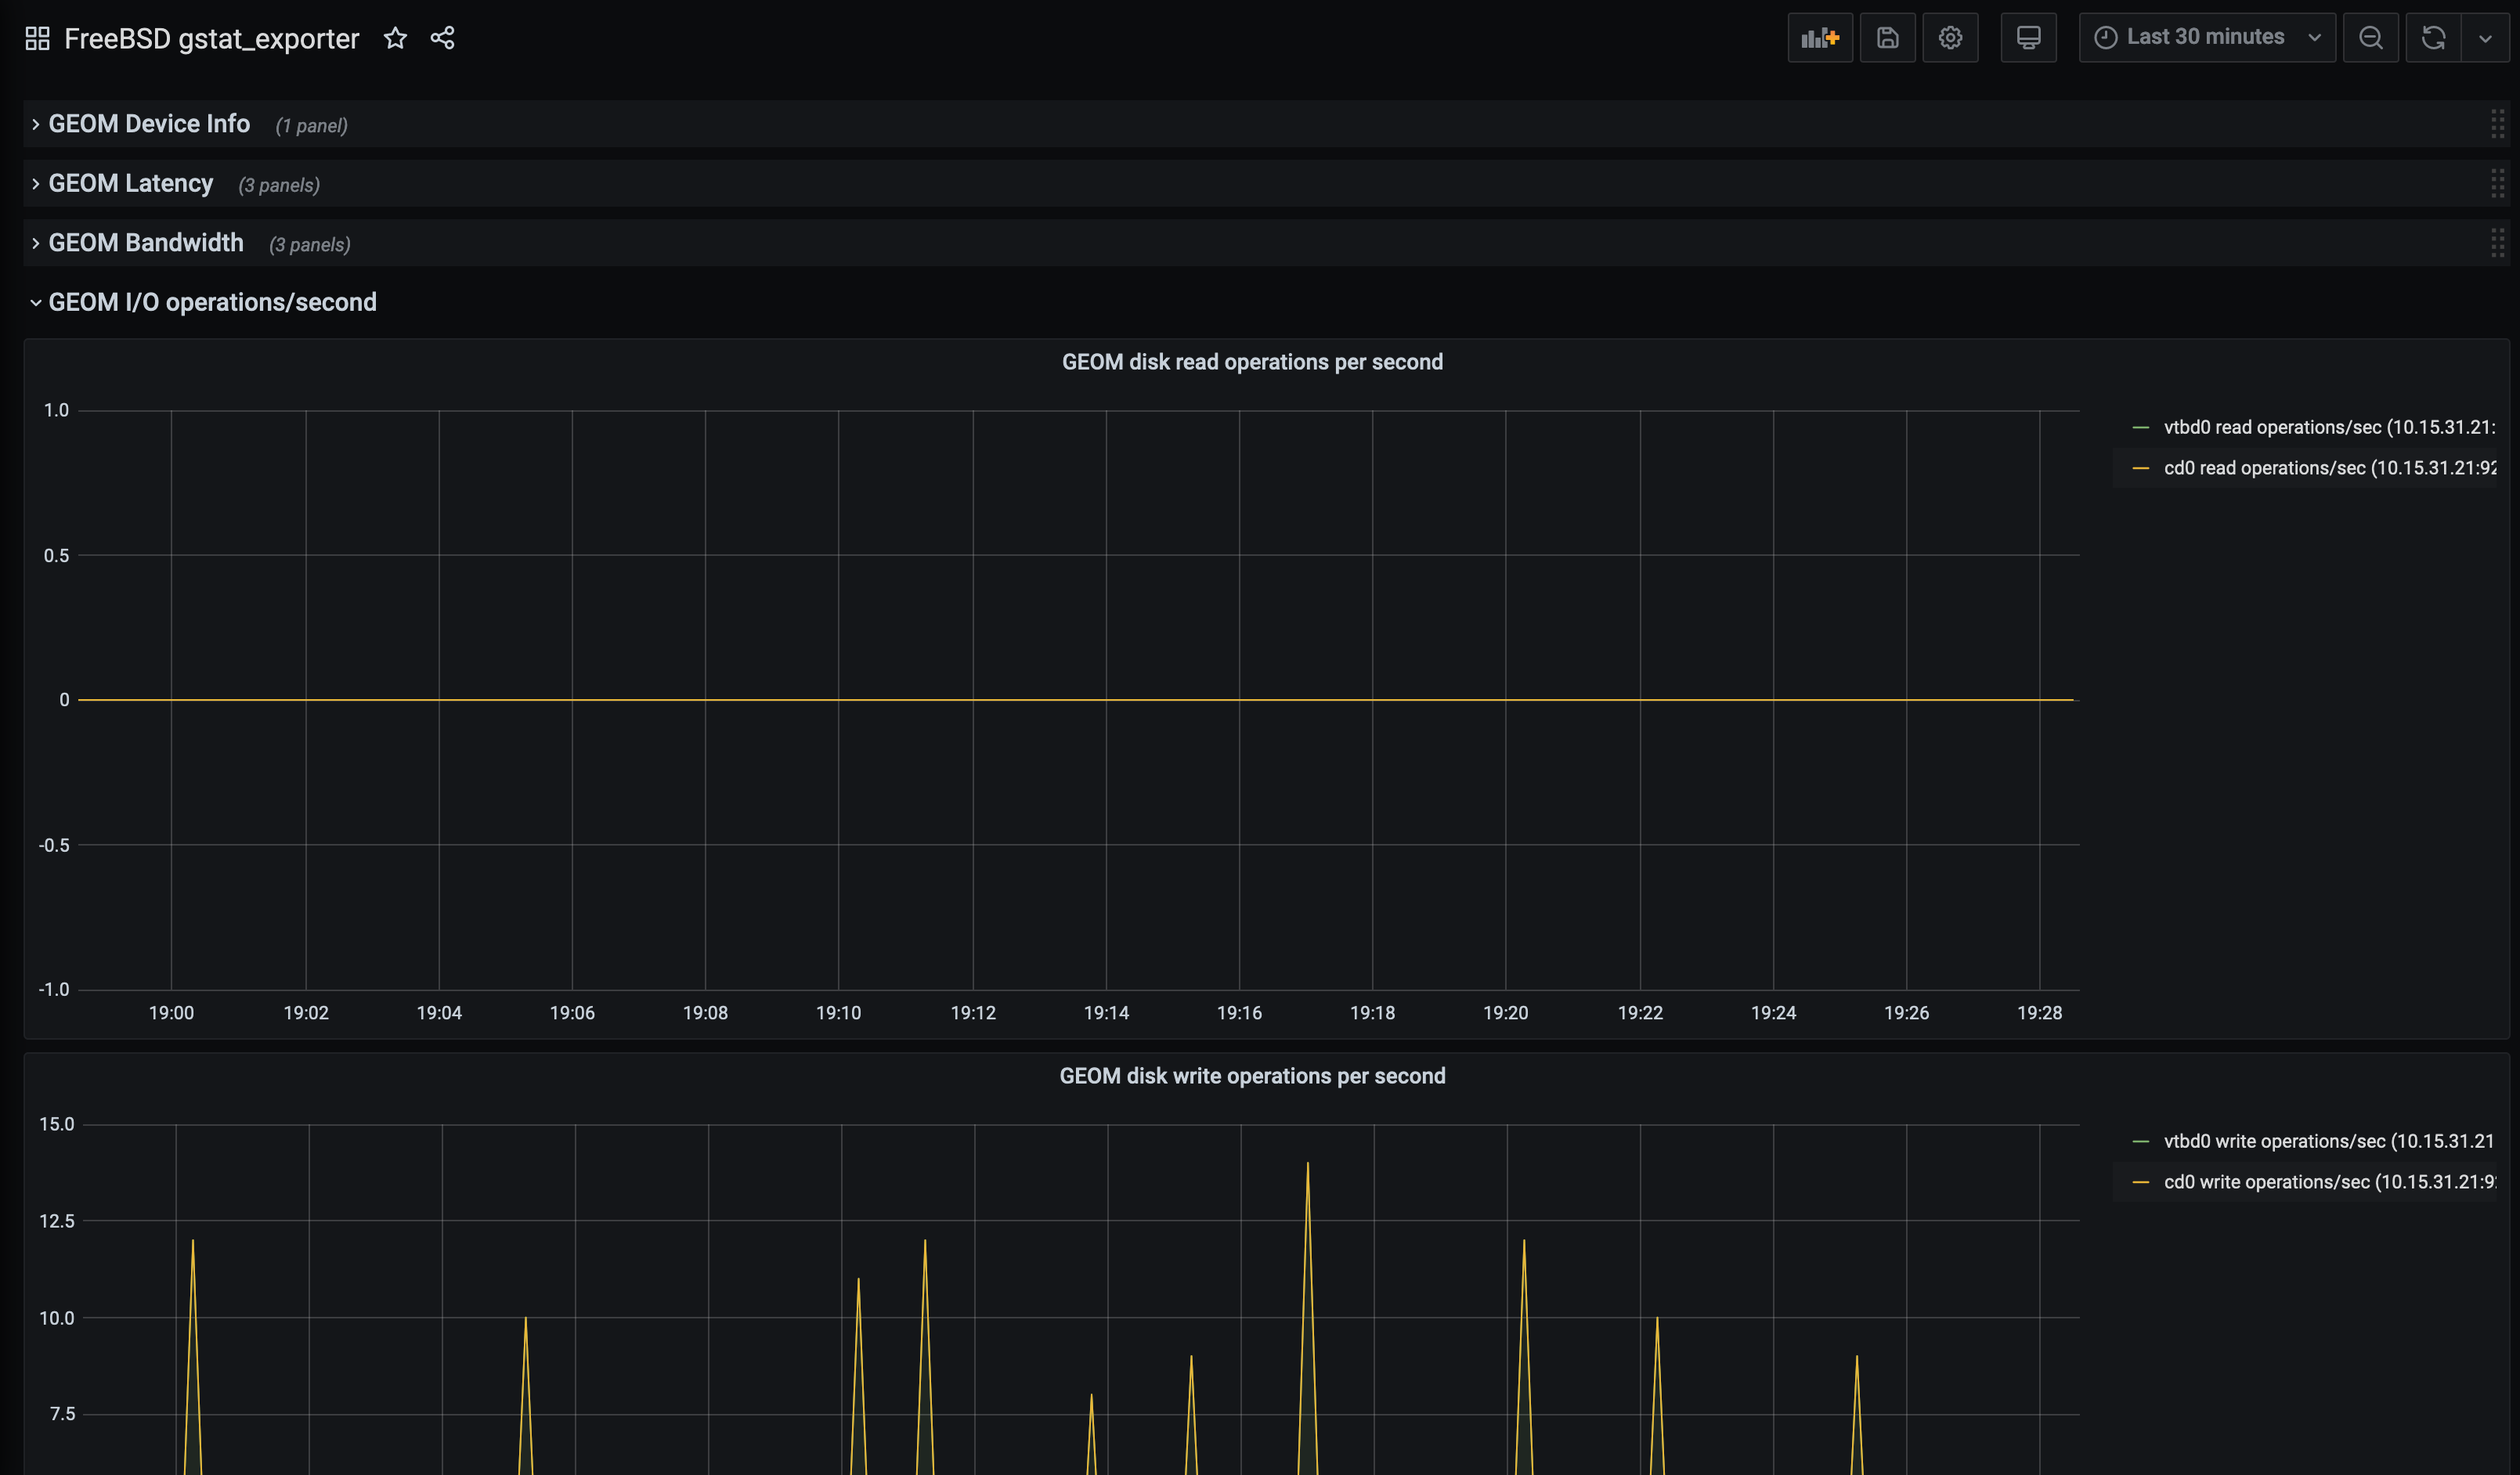
The creator of the Gstat Exporter also made a Grafana dashboard to go with it: -

Summary
In this, we showed that FreeBSD can be managed and monitored using the same tools as Linux, Windows and OpenBSD. We also deployed another exporter without making any fundamental changes to our states.
Again, if you are running infrastructure across many different systems, automatically monitoring your systems and managing them consistently removes a lot of the barriers to adopting the right system for the right purpose. Choose OpenBSD for the security, FreeBSD for ZFS and jails, Windows for Active Directory and Linux for Docker containers, gives you a very capable infrastructure without the additional overhead of managing each separately.
In the next post in this series, we will cover how you deploy SaltStack on an illumos-based host (running OmniOS), which will then deploy Consul and the Prometheus Node Exporter.
devops monitoring prometheus consul saltstack freebsd
technical prometheus monitoring config management
2401 Words
2020-06-30 19:05 +0000