13 minutes
Prometheus: Embracing the Exporter Life
A couple of months ago I decided to start monitoring my home network. This was in part due to frequent dropouts of an Amazon Firestick. This usually happened in the middle of the kids watching Peppa Pig or Paw Patrol. Nothing like family-driven monitoring!
I originally setup Nagios and Zabbix. My home “network” mostly consists of a few Raspberry Pis, a couple of other random ARM boards, and a mish mash of cheap switches (see: unmanaged low end TP Link/Netgear, not old enterprise kit) and routers.
This is all in dire need of an update, but not really feasible currently.
Why Nagios and Zabbix?
I used Nagios and Zabbix for three reasons.
Familiarity
Nagios is the primary monitoring tool at my current workplace. It has a number of shortcomings, including not being very dynamic and the configuration takes a lot of getting used to. Also I had to use Debian Buster (well, Raspbian Buster) for my monitoring host as Nagios was pulled from the Debian archives in Debian Stretch, with Debian pushing people to use Icinga2 instead.
However I know it well enough to be able to get an instance up and running, and monitoring all elements of my home network in a couple of hours at most.
Learning Zabbix
We do use Zabbix at my workplace, but it isn’t a primary monitoring tool. Other than adding a couple of graphs, I’d had little to no involvement in using or configuring it. At least by doing this, I could get more of a handle on Zabbix itself.
Raspberry Pi 2
The only “host” I had spare was a Raspberry Pi 2. Using anything more demanding (which given I’ve seen Observium bring a fairly decent spec’d Dell server to its knees) was out of the question.
Not enough monitoring
I had monitored all my internal network, as well as my VPS. I was getting some useful statistics, and it helped me fix a few underlying issues I had either not noticed, and half-ignored to deal with another day. Having it flash up in a monitoring system made me put time into actually fixing the issues.
While I had more visibility of what was happening in my home network, the default check times on Nagios made it so I’d actually not see the problems quick enough. The Firestick would drop out, but by the time Nagios was ready to do another check, the Firestick would have come back (or it would have been rebooted so the kids can see Grampy Rabbit or Chase again). Increasing the frequency of the checks would probably tax the little RPI too much.
I looked around to see if anything else could do the job, but I couldn’t realistically just rip down a monitoring stack and plug in a new one, in the hope it was better.
I wondered about Icinga2, Check_MK and other Nagios-based tools, but they either added more resource requirements or would still have some of the same issues as Nagios.
I liked the idea of Sensu, but there was no way I could standup Redis and RabbitMQ just for this. Besides, the minimum requirements to run it were more than all the devices in my house combined.
Zabbix was good, but I found it did a much better job of networking gear than it did Linux or generic blackbox-style monitoring. Not to say it was bad at it, but it is the kind of monitoring tool I would have killed for in my previous career (i.e. a Network Engineer).
Prometheus?
Anyone who’s looked into monitoring for the past few years will likely have heard of Prometheus. Rather than doing checks based upon scripts returning status codes, it gathers metrics from endpoints and stores them in a Time Series Database (TSDB).
It is not the kind of monitoring tool that you’d use to kick off a Bash/Perl/Python/other language script (i.e. the Nagios-style approach) to check on the status of a server/application. It is mainly used to gather metrics.
An example of what you would get back from a “Metrics” endpoint would be: -
# HELP node_systemd_units Summary of systemd unit states
# TYPE node_systemd_units gauge
node_systemd_units{state="activating"} 0
node_systemd_units{state="active"} 260
node_systemd_units{state="deactivating"} 0
node_systemd_units{state="failed"} 0
node_systemd_units{state="inactive"} 76
The above has something called a label (the state variable in the braces) and a number. This is then stored in the Prometheus TSDB
It says something like “At time HH:MM:SS:ms, 260 SystemD units were active”. A few seconds later Prometheus would check again, and store “At time HH:MM:SS+10s:ms, 259 SystemD units were active”. The actual way it is stored is not in plain English, this is more to give you an idea of how just pulling back a number is useful.
How to do it?
At my workplace, we are looking to implement Prometheus. I wanted to get a bit of a headstart on using it. However with the little Raspberry Pi 2 already running Nagios and Zabbix (and I also threw Smokeping onto it for fun), I thought it would be a bit much.
Thinkpad to the rescue
I had a Thinkpad X220 sitting around collecting dust. It is a great little laptop, but I don’t use it enough. However looking online it does appear to not use a lot of power, and is still a fairly capable machine.
It also has it’s own in-built UPS (most would call it a laptop battery), and KVM (or, screen and keyboard) for the times I break it!
I installed Debian Buster on it, no desktop, and was away.
Basic setup
A very basic setup of Prometheus is very straightforward. All you need to do is download the latest release, extract it and run it.
For example, to run it locally on my Mac: -
$ wget https://github.com/prometheus/prometheus/releases/download/v2.13.0/prometheus-2.13.0.darwin-amd64.tar.gz
$ tar -xvzf prometheus-2.13.0.darwin-amd64.tar.gz
$ cd prometheus-2.13.0.darwin-amd64
$ ./prometheus
level=info ts=2019-10-06T09:13:45.418Z caller=main.go:296 msg="no time or size retention was set so using the default time retention" duration=15d
level=info ts=2019-10-06T09:13:45.419Z caller=main.go:332 msg="Starting Prometheus" version="(version=2.13.0, branch=HEAD, revision=6ea4252299f542669aca11860abc2192bdc7bede)"
level=info ts=2019-10-06T09:13:45.419Z caller=main.go:333 build_context="(go=go1.13.1, user=root@f30bdad2c3fd, date=20191004-11:33:07)"
level=info ts=2019-10-06T09:13:45.419Z caller=main.go:334 host_details=(darwin)
level=info ts=2019-10-06T09:13:45.420Z caller=main.go:335 fd_limits="(soft=256, hard=unlimited)"
level=info ts=2019-10-06T09:13:45.420Z caller=main.go:336 vm_limits="(soft=unlimited, hard=unlimited)"
level=info ts=2019-10-06T09:13:45.421Z caller=main.go:657 msg="Starting TSDB ..."
level=info ts=2019-10-06T09:13:45.421Z caller=web.go:450 component=web msg="Start listening for connections" address=0.0.0.0:9090
level=info ts=2019-10-06T09:13:45.424Z caller=head.go:512 component=tsdb msg="replaying WAL, this may take awhile"
level=info ts=2019-10-06T09:13:45.425Z caller=head.go:560 component=tsdb msg="WAL segment loaded" segment=0 maxSegment=0
level=info ts=2019-10-06T09:13:45.426Z caller=main.go:672 fs_type=19
level=info ts=2019-10-06T09:13:45.426Z caller=main.go:673 msg="TSDB started"
level=info ts=2019-10-06T09:13:45.426Z caller=main.go:743 msg="Loading configuration file" filename=prometheus.yml
level=info ts=2019-10-06T09:13:45.440Z caller=main.go:771 msg="Completed loading of configuration file" filename=prometheus.yml
level=info ts=2019-10-06T09:13:45.440Z caller=main.go:626 msg="Server is ready to receive web requests."
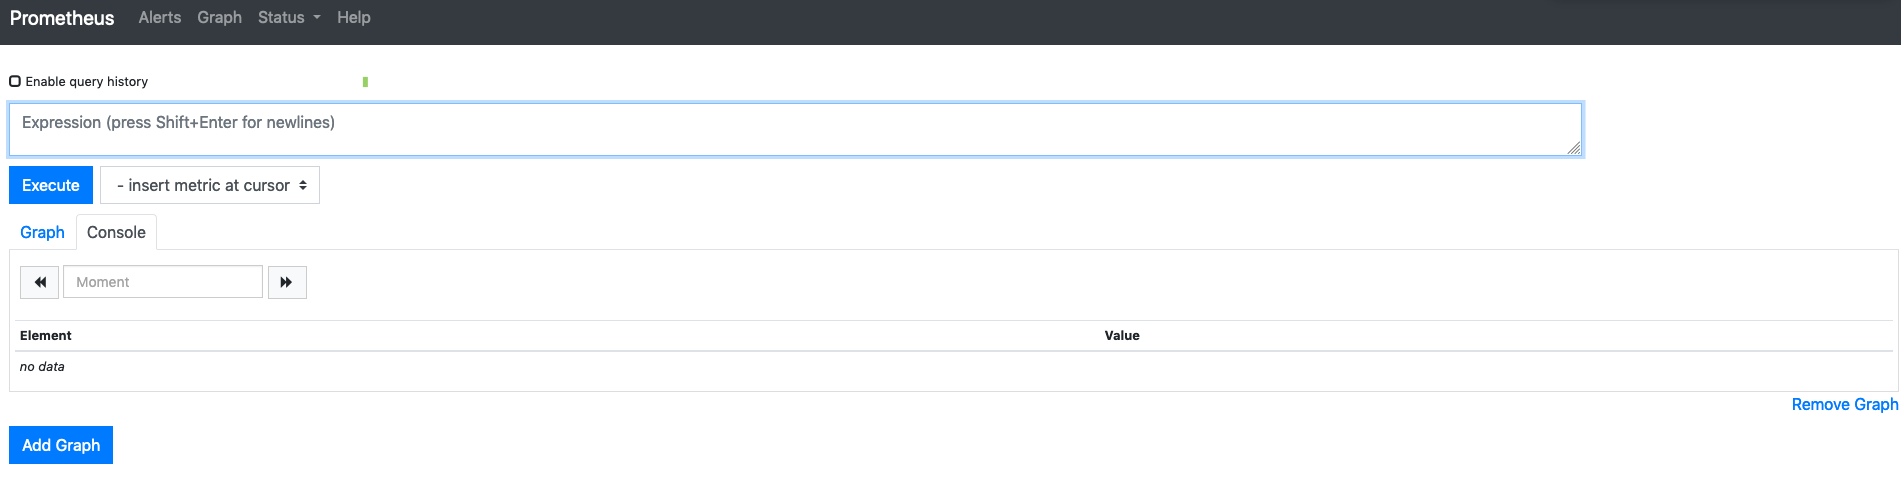
Go to http://localhost:9090 in your browser, and you’ll see the Prometheus interface
Initially, the only metrics it has to begin with are the metrics of the Prometheus daemon itself. You can see this by going to Status > Targets
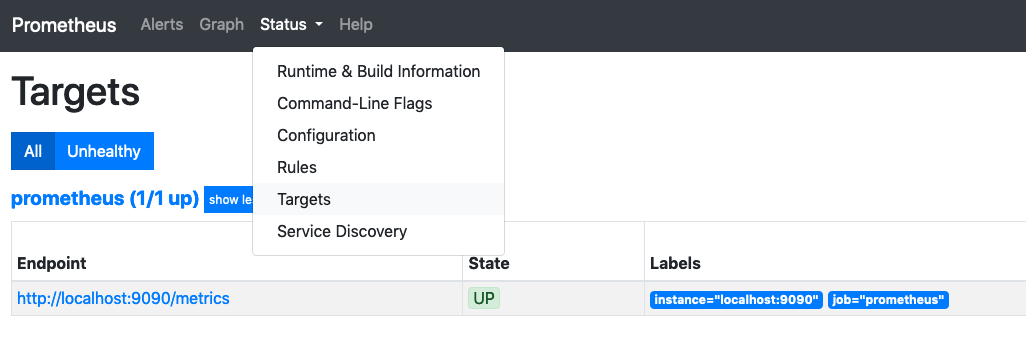
This first target still has a lot of metrics to begin with, which you can see by visiting http://localhost:9090/metrics.
Add more targets
To add more targets to Prometheus, you add them into the prometheus.yml configuration. If you are just testing this, there is an example YAML file in the same directory as you extracted Prometheus to.
## my global config
global:
  scrape_interval:     15s # Set the scrape interval to every 15 seconds. Default is every 1 minute.
  evaluation_interval: 15s # Evaluate rules every 15 seconds. The default is every 1 minute.
  # scrape_timeout is set to the global default (10s).

## Alertmanager configuration
alerting:
  alertmanagers:
  - static_configs:
    - targets:
      # - alertmanager:9093

## Load rules once and periodically evaluate them according to the global 'evaluation_interval'.
rule_files:
  # - "first_rules.yml"
  # - "second_rules.yml"

## A scrape configuration containing exactly one endpoint to scrape:
## Here it's Prometheus itself.
scrape_configs:
  # The job name is added as a label `job=<job_name>` to any timeseries scraped from this config.
  - job_name: 'prometheus'

    # metrics_path defaults to '/metrics'
    # scheme defaults to 'http'.

    static_configs:
    - targets: ['localhost:9090']
There are a number of other elements like Alertmanager (which can be used to send alerts from Prometheus to your system of choice, e.g. PagerDuty, OpsGenie, Slack etc), and rules files, but to add another target is very simple. You can add another line to the static_configs directive, or you can create a new job.
Jobs can be very basic (with nothing but a name and targets), or they can change labels (say, replace the target name e.g. localhost:9090 with the instance hostname for example), or many other things.
However, not every application supports Prometheus metric output by default, so you will more than likely need to use exporters
Add exporters
Exporters are used to pull data about an application, infrastructure, or from SNMP, or whatever you want so long as it can export some form of meaningful metric. It is possible to write metrics to a file and have Prometheus (via the Node Exporter) pull them.
The most likely exporter to start with is the Node Exporter, which exposes metrics about the host it is running on. This can be used to monitor CPU, memory, disk space, status of services, ongoing network activity, and far more.
To install the Node Exporter, again download the latest release for your architecture, untar it, go into the directory, and run it. When you do, you’ll see that it is exposing metrics on TCP port 9100
$ cd node_exporter-0.18.1.darwin-amd64
$ ./node_exporter
INFO[0000] Starting node_exporter (version=0.18.1, branch=HEAD, revision=3db77732e925c08f675d7404a8c46466b2ece83e)  source="node_exporter.go:156"
INFO[0000] Build context (go=go1.11.10, user=root@4a30727bb68c, date=20190604-16:47:36)  source="node_exporter.go:157"
INFO[0000] Enabled collectors:                           source="node_exporter.go:97"
INFO[0000]  - boottime                                   source="node_exporter.go:104"
INFO[0000]  - cpu                                        source="node_exporter.go:104"
INFO[0000]  - diskstats                                  source="node_exporter.go:104"
INFO[0000]  - filesystem                                 source="node_exporter.go:104"
INFO[0000]  - loadavg                                    source="node_exporter.go:104"
INFO[0000]  - meminfo                                    source="node_exporter.go:104"
INFO[0000]  - netdev                                     source="node_exporter.go:104"
INFO[0000]  - textfile                                   source="node_exporter.go:104"
INFO[0000]  - time                                       source="node_exporter.go:104"
INFO[0000] Listening on :9100                            source="node_exporter.go:170"
You can then add this into your Prometheus YAML config with something like the below: -
  - job_name: 'node_exporter'
    static_configs:
    - targets: ['localhost:9100']
Reload Prometheus (stopping and starting it will work if you’re just testing) and you should now see something like this in your Targets
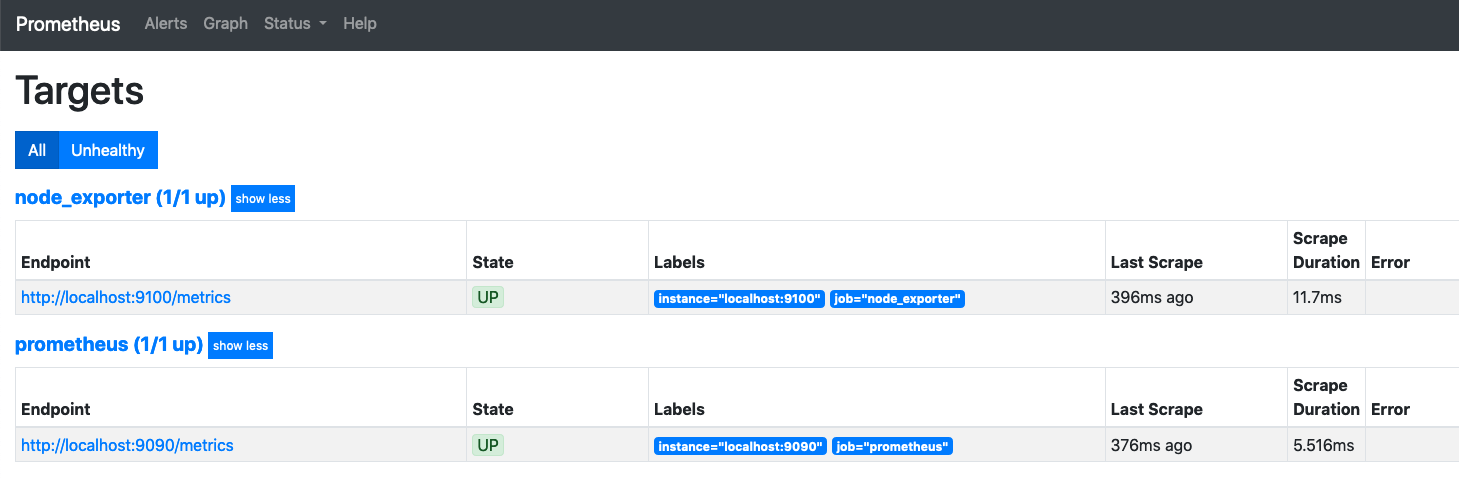
Most exporters run on their own port (usually in the TCP 9000-9999) range. Other than a couple of cases, if you take the configuration above, change the name (to make it more meaningful, you could use the same job for everything if you wanted to), and put the correct IP and Port of the where the metric is running, you’ll get metrics in Prometheus from them.
See the metrics in Prometheus
To see what Metrics are being returned and stored in Prometheus, go to the Graphs tab and start typing the word node into the Expression input box.
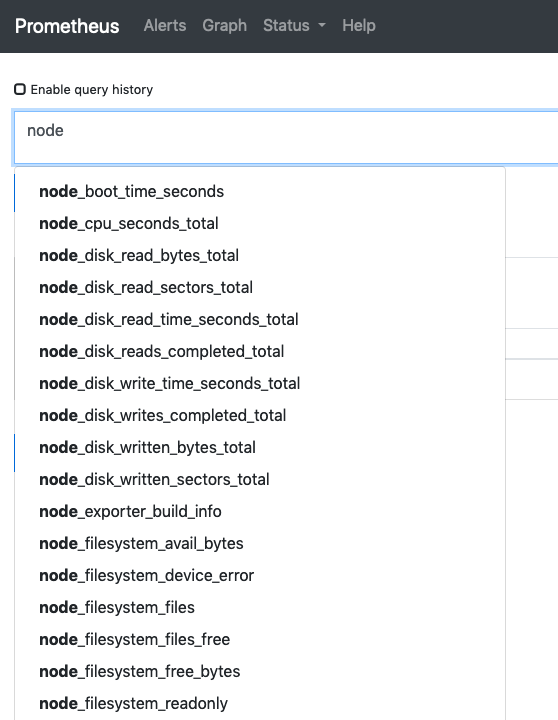
The above is a truncated list, far more metrics are available.
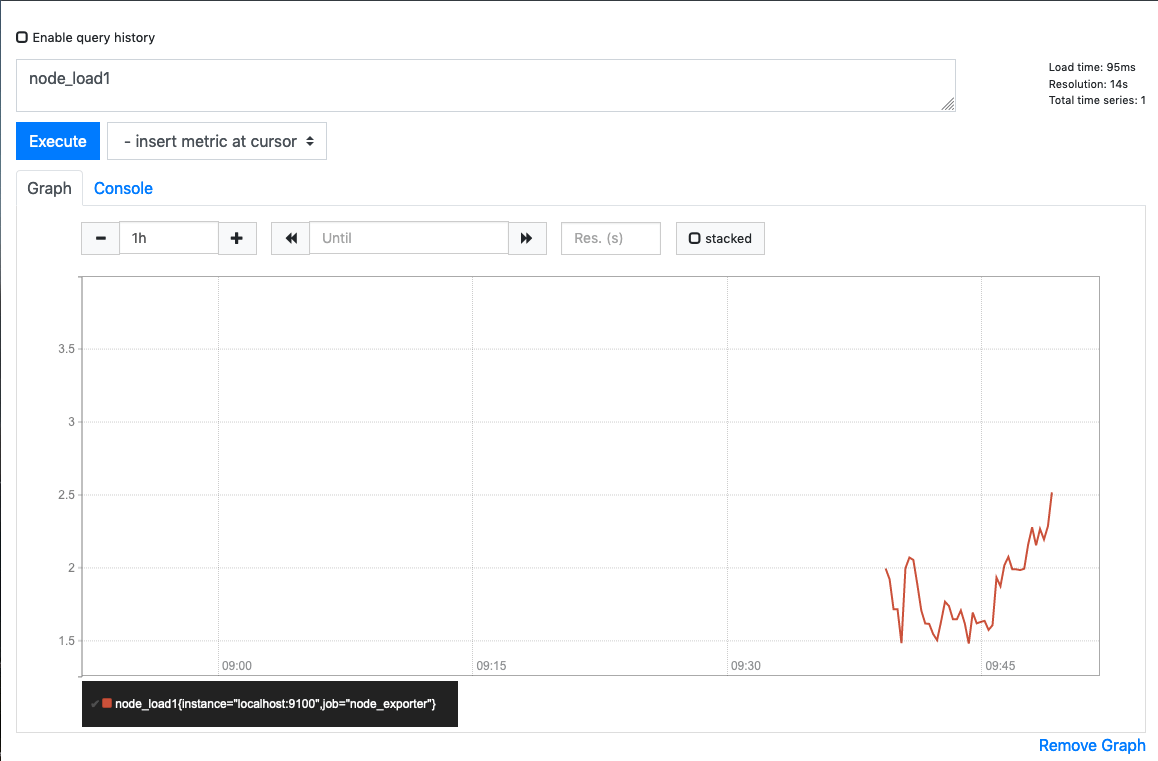
If we chose the Load Average of the Node for the past minute, we would see: -
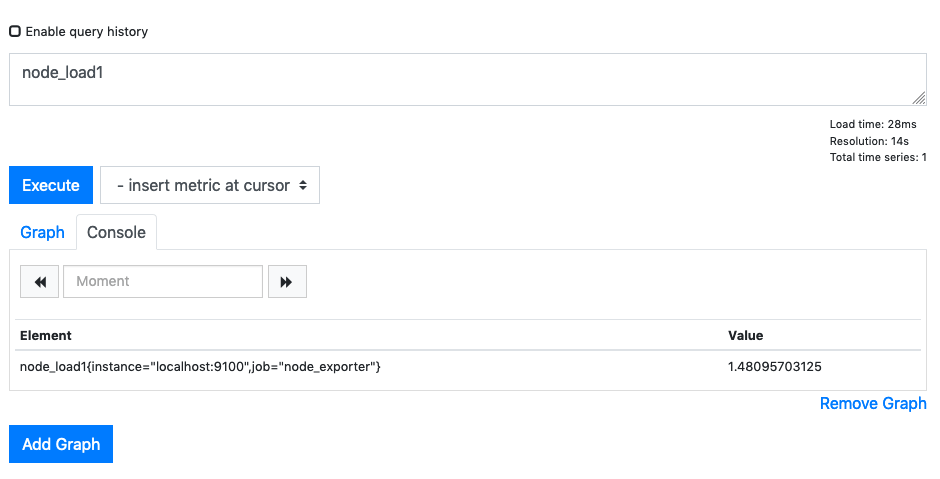
You can take a quick look at the Graph of this too: -
More exporters
There a number of different exporters, everything from monitoring the status of NGINX, to running ping and DNS checks, and much more. Below is a list of all the ones I use
- apache_exporter - Gets metrics from Apache
- bind_exporter - Exposes metrics from BIND
- blackbox_exporter - For monitoring ICMP (ping), DNS, HTTP checks and more - useful for when you do not have access to the internals of the system (for example, a Firestick!)
- cadvisor - Technically not an Exporter, but it does expose metrics natively. This exposes metrics of all running Docker containers on a host
- dhcp_exporter - Exposes metrics for ISC DHCP pool usage
- iptables_exporter - Exposes metrics for IPTables
- libvirt_exporter - Exposes metrics for Libvirt on Linux (e.g. for KVM Virtualisation)
- mikrotik_exporter - Exposes metrics from Mikrotik RouterBoard equipment
- mysqld_exporter - Exposes metrics for MySQL
- nginx_exporter - Exposes metrics for NGINX, which I use for a Reverse Proxy
- nrpe_exporter - Used to check the results of Nagios-based NRPE checks
- pihole_exporter - Exposes metrics for Pi-Hole (DNS-based ad blocker)
- wireguard_exporter - Exposes metrics for Wireguard VPNs - This requires installing Rust dependencies and compiling
How do I make it look pretty?
For how brilliant Prometheus is, it isn’t made to look pretty, merely to be functional and not an eyesore.
However, Grafana can use Prometheus as a data source. Grafana dashboards can be very, very pretty (if your thing is graphs, statistics and statuses) and a number of the exporters already have suggested dashboards. You can also go through the Grafana Dashboards page and find a number that are built by others for Prometheus (and other tools).
Install Grafana
To install Grafana, I use Docker. This is done like the below: -
docker run \
  -d \
  -p 3000:3000 \
  --name=grafana \
  -v grafana-storage:/var/lib/grafana \
  -e "GF_INSTALL_PLUGINS=alexanderzobnin-zabbix-app,grafana-piechart-panel,raintank-worldping-app,camptocamp-prometheus-alertmanager-datasource,farski-blendstat-panel" grafana/grafana
The above pull the Grafana docker container, names it Grafana, adds a persistent directory on your host (so that configuration isn’t lost if you restart the container) and installs a number of other plugins. The extra plugins aren’t necessary, but they add useful functionality if you would like to use them.
If you do not want any of the extra plugins, remove everything from -e to just before grafana/grafana.
Run Grafana
When you go to Grafana for the first time (http://your-host-ip:3000) you will be given the option to setup authentication and a number of other settings. Go through all of this, and then when you get to the Add Data Sources section, you need to add something like the following for Prometheus: -
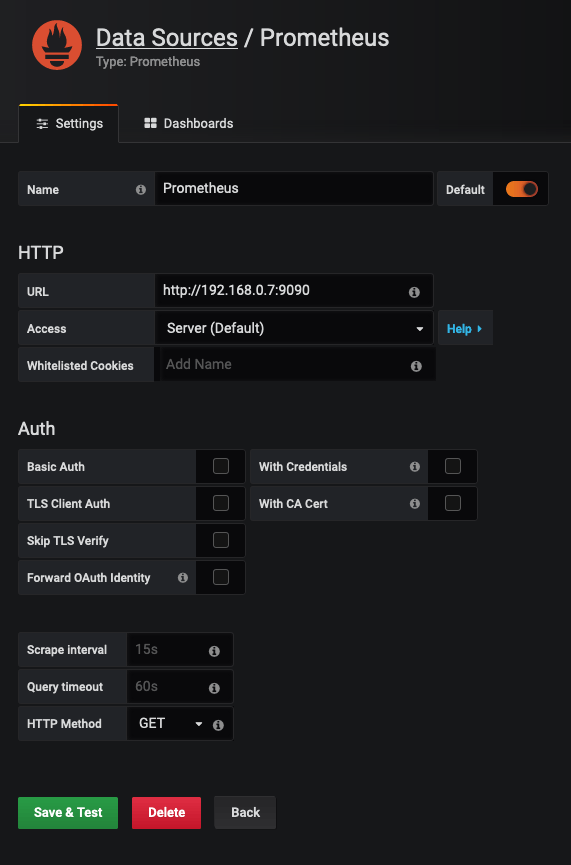
Do not put in http://localhost:9090 for your URL, as Prometheus is not running in the same Docker container.
Click Save & Test, and you should be connected to your Prometheus data source.
Import Dashboards
Importing a dashboard into Grafana is a case of taking the ID of the dashboard (you’ll see this on the side of the page on the Grafana Dashboards site
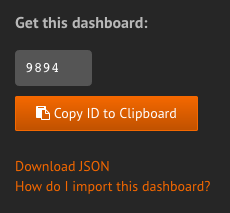
In Grafana itself, go to to the Four Boxes icon at the top of the main page, and you should see Import Dashboard
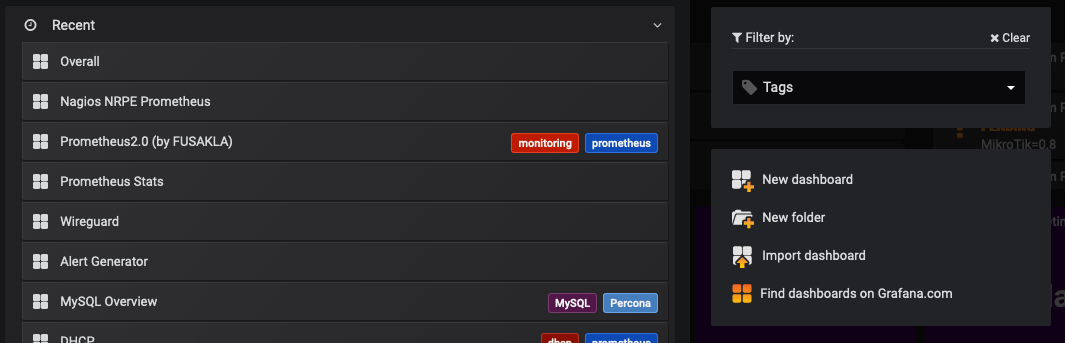
This will ask you to either put in the Grafana.com Dashboard ID (that you retrieve before) or paste the full JSON. Some dashboards are not hosted on Grafana itself, so you can just copy and paste the contents of the actual Dashboard JSON file and paste them in here
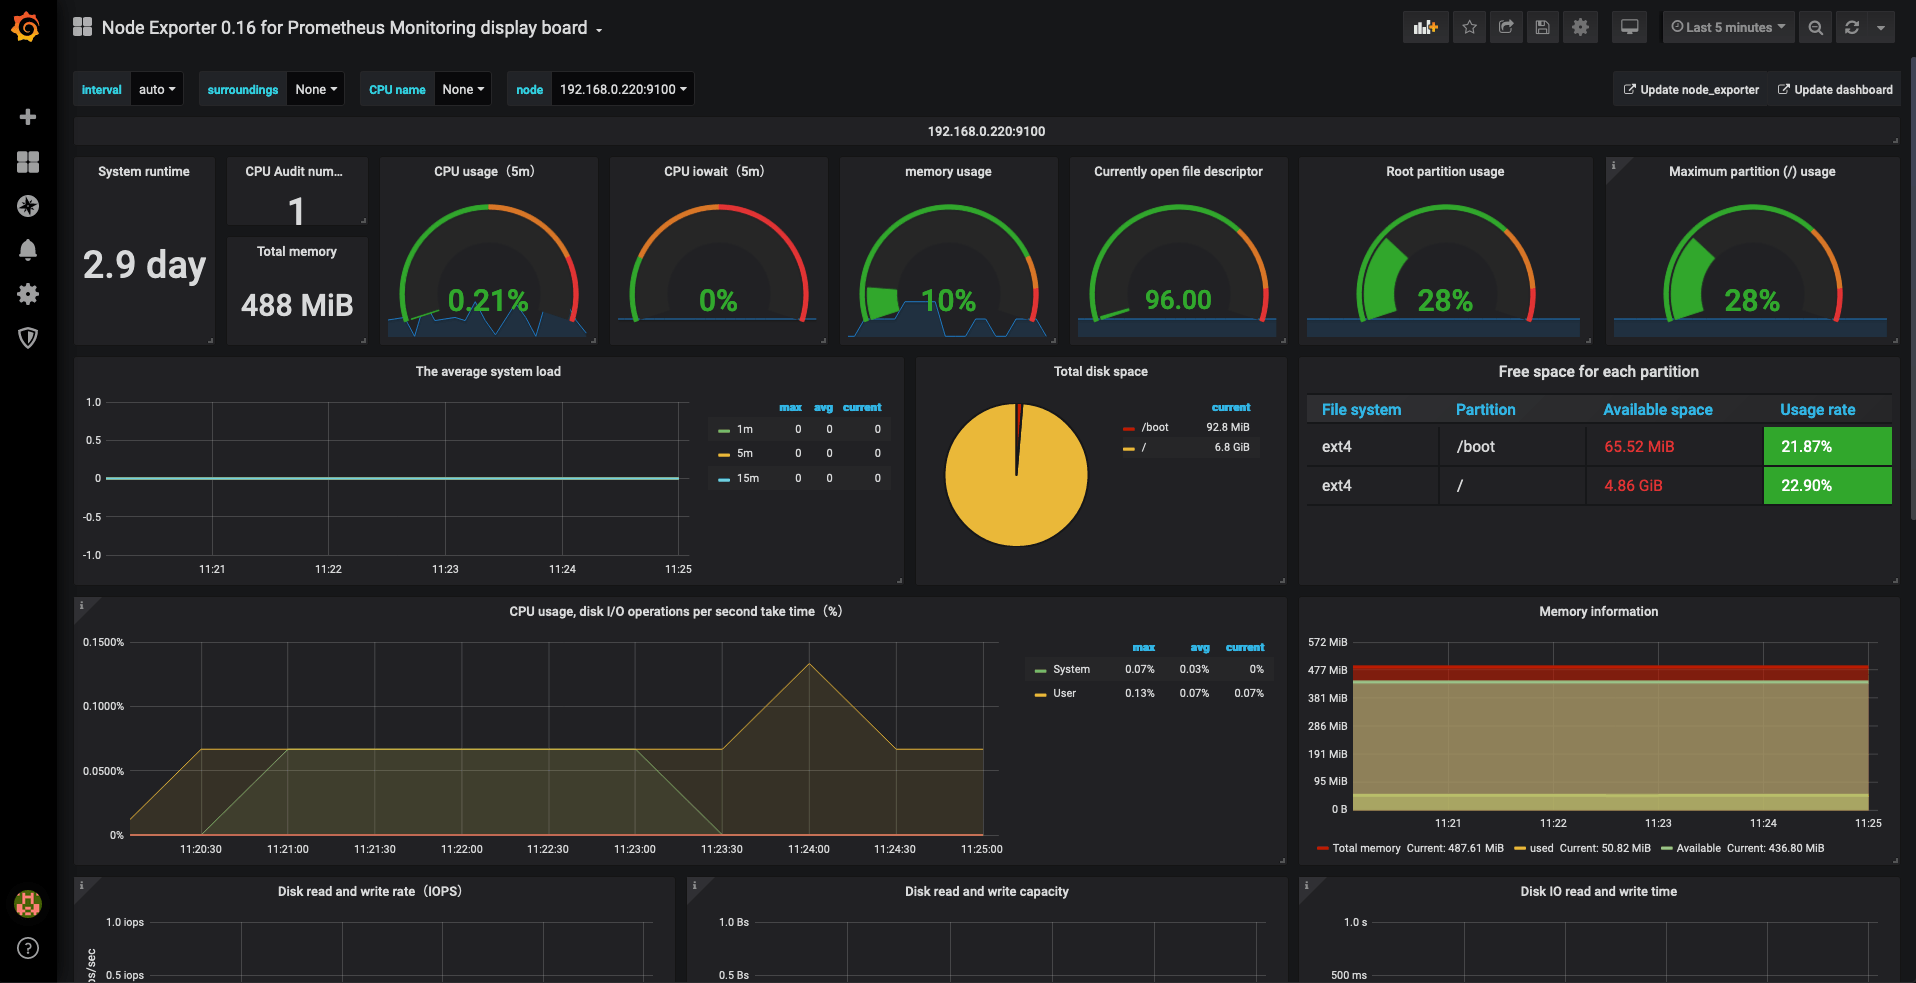
Beautiful Dashboards
After you have done the above, you will be able to add dashboards and look through statistics. For example, the Node Exporter 0.16 for Prometheus Monitoring display board looks like the below: -
I have also put my own Dashboard together with stats that I’m interested in, which looks something like the below: -
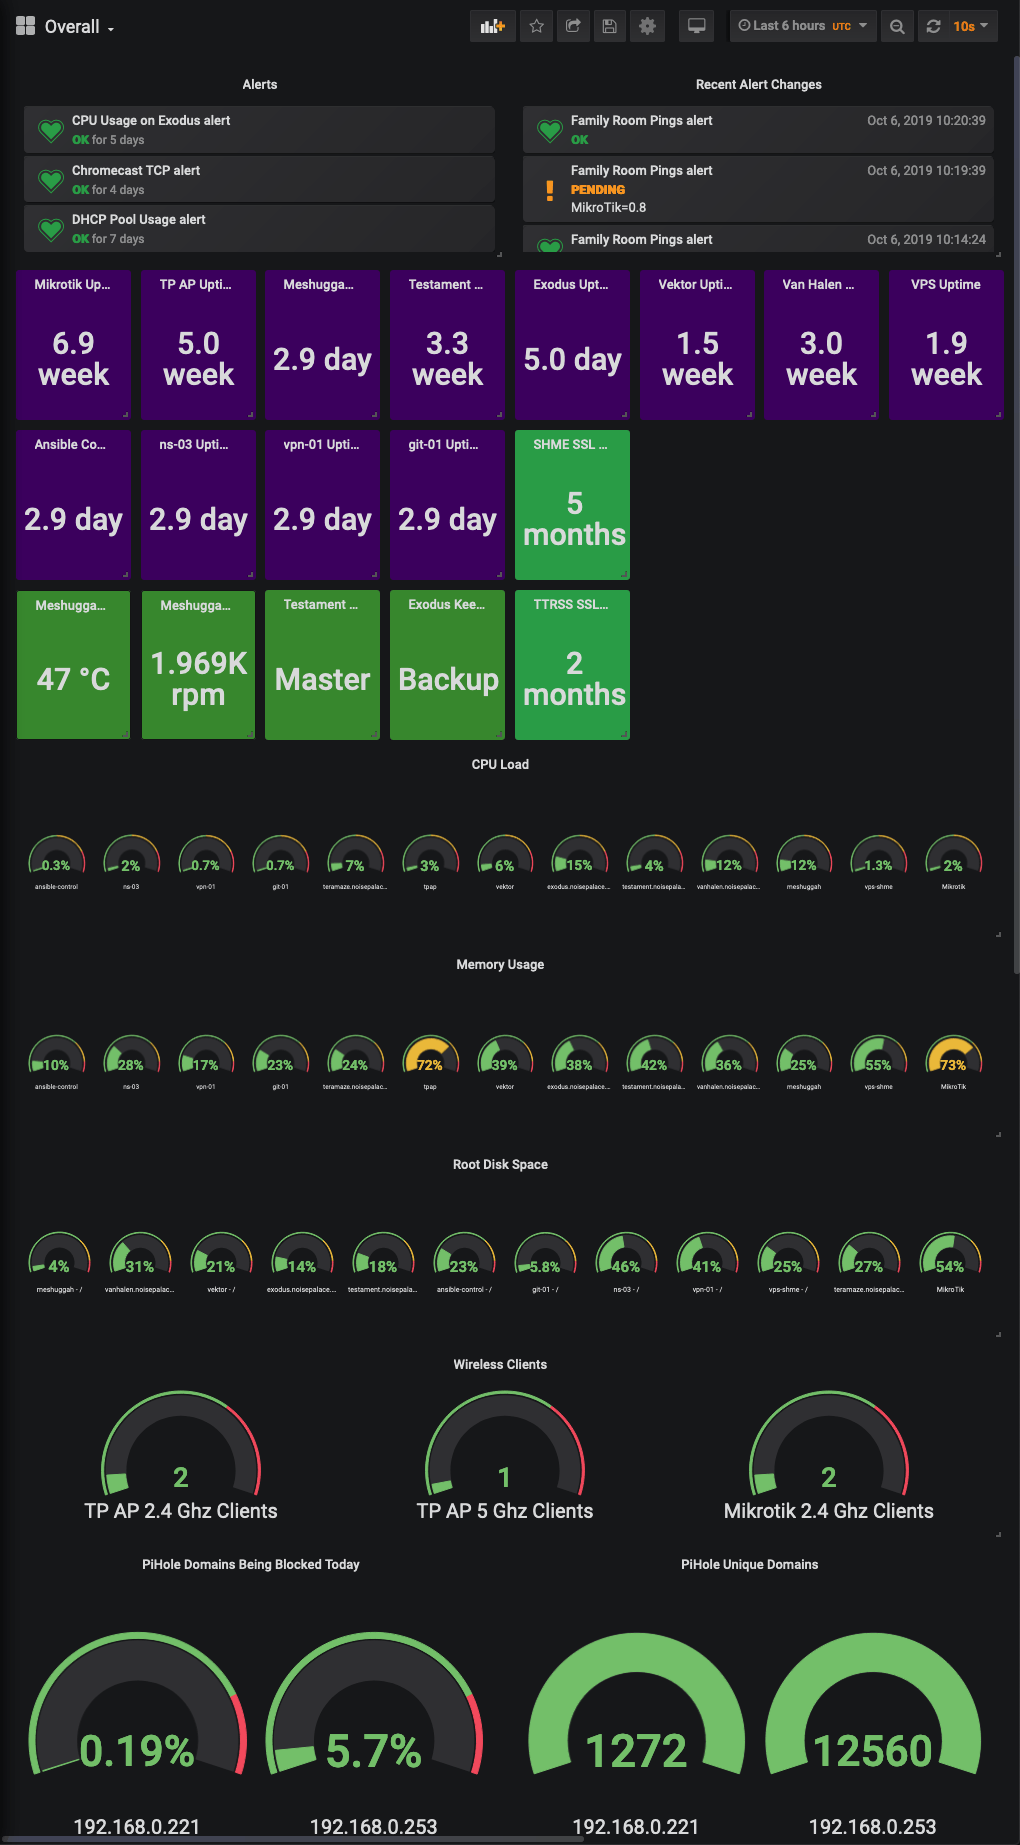
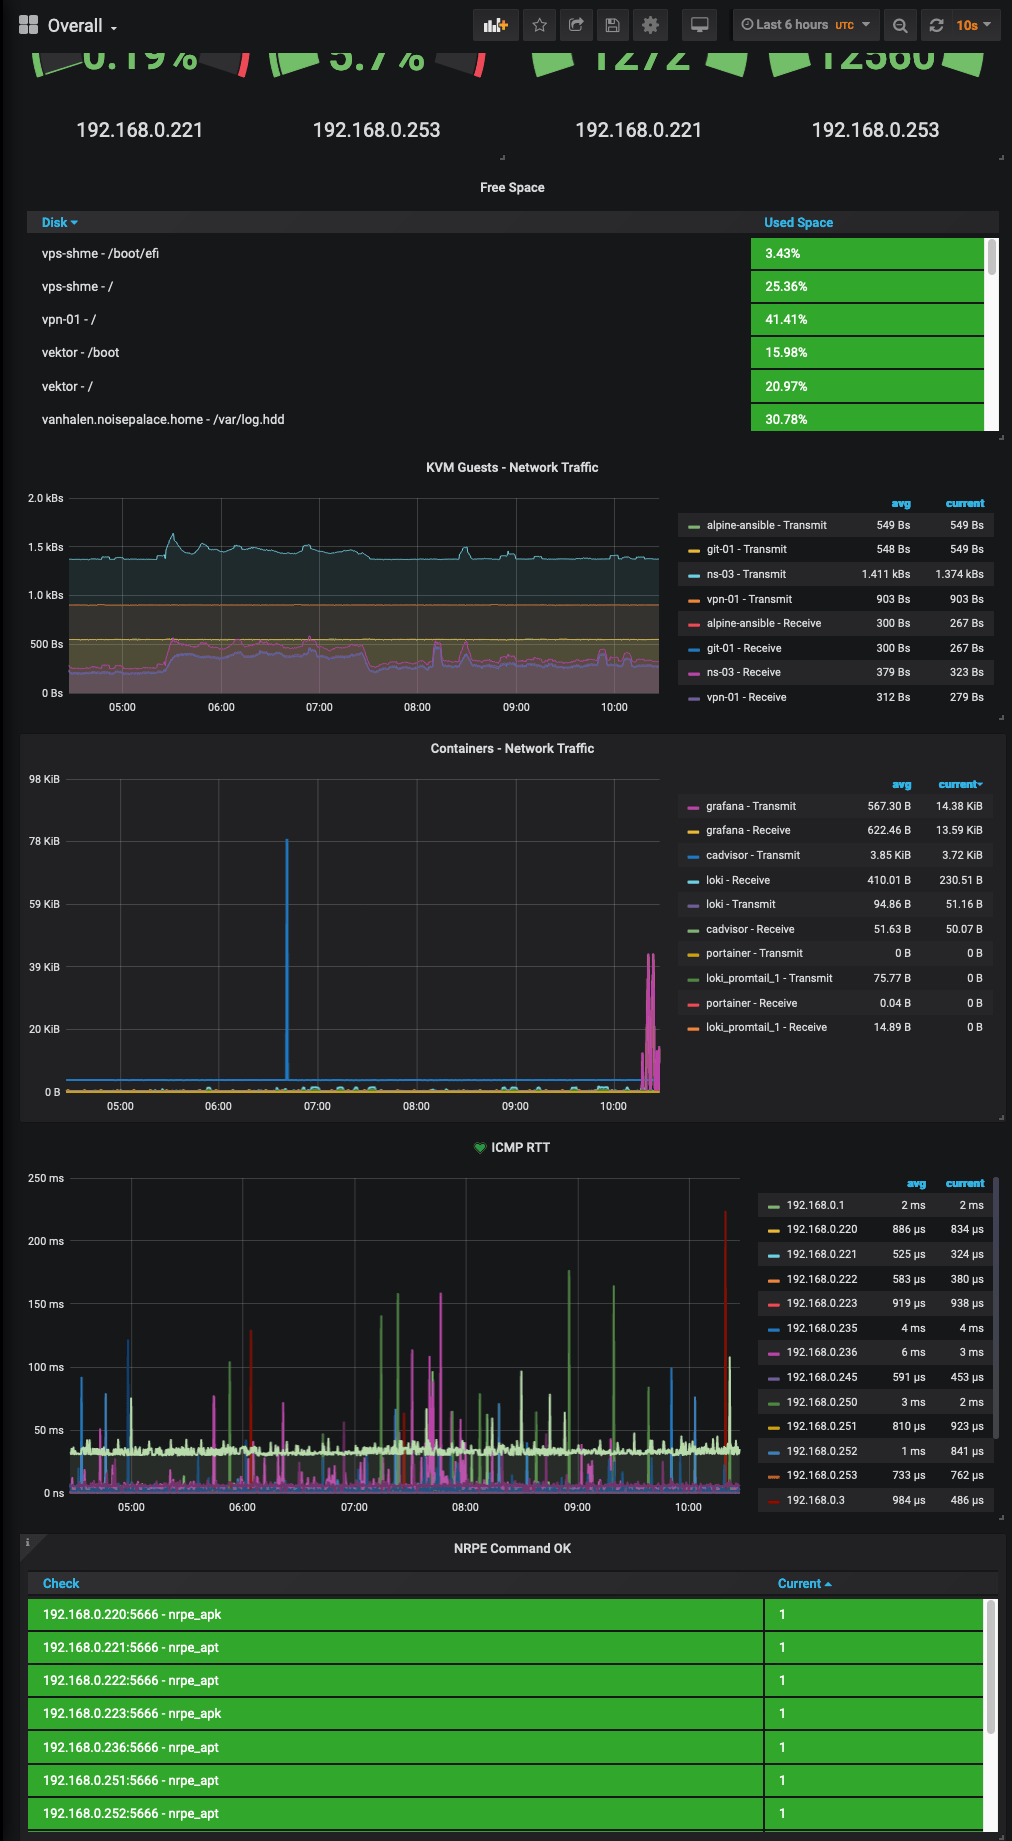
Yes, all of my infrastructure (mostly) is named after metal bands. No, I will not apologise 🤘
Summary
So after all of this, I went through the process of replacing everything I had in Nagios and Zabbix with Prometheus. Over a couple of days (and by days, I mean couple of hours here and there after the kids were in bed) I moved everything to exporters and now I get much more up to date statistics.
Being able to use the NRPE Exporter helped in removing some checks that do not really expose metrics correctly (or would require writing complex daemons for gathering simple checks). For a video on the NRPE Exporter by Brian Brazil (a core Prometheus developer), see below: -
Unfortunately, it turns out that even with all of this, the problem with the Firestick actually appears to be the use of Powerline adapters in an early 1900s house with internal cabling from an unknown time. Still, it was fun to work that out!
devops monitoring prometheus grafana
technical prometheus monitoring
2566 Words
2019-10-06 08:23 +0000