9 minutes
Prometheus: Discovering Services with Consul
In my previous post, I detailed moving my home monitoring over to Prometheus. I’ve gained huge insights into my home network (and a few external services I rely on), and have been very happy with it.
Adding new endpoints has been pretty straightforward. I have been using Ansible to generate the prometheus.yml configuration file, using variables to generate each section of the scrape configuration. This has worked equally well for both services exposing native Prometheus endpoints (e.g. Cadvisor or Traefik) and for the numerous exporters I am running.
The issue with this approach is that it requires reloading the Prometheus configuration every time I add a service and/or an endpoint. It also requires a central point of configuration management to decide what is monitored, rather than hosts notifying something that it has a Prometheus-compatible metrics endpoint.
Enter Service Discovery
Service Discovery
As Wikipedia describes: -
Service discovery is the automatic detection of devices and services offered by these devices on a computer network.
Put another way, it allows an application to dynamically discover services, rather than the services being statically defined in the applications configuration.
For Prometheus, there a number of methods it can use for service discovery. These range from talking to cloud provider APIs (like AWS, Azure, GCE), DNS-based discovery (using SRV records) to querying the Kubernetes API for running services.
I have chosen Consul, a configuration and service store by Hashicorp (who also created Terraform, Packer and Vagrant).
Consul
Consul uses a Server/Client-style approach. The recommendation for production usage is a minimum of three servers (for quorum), however in a home environment you can run it as low as one.
Agents register with the server(s), and will supply a list of services that are running on them. Adding additional services can be done via the Consul CLI, the API, or you can do it using files that are in the Consul configuration directory.
The Hashicorp documentation on setting up a cluster is very good, so I would advise reading this and following it if you want to set up a cluster of your own. I made a couple of changes to it to suit my environment, as detailed below.
Server Configuration
My setup on the server is configured as such: -
/etc/systemd/system/consul.service
[Unit]
Description="HashiCorp Consul - A service mesh solution"
Documentation=https://www.consul.io/
Requires=network-online.target
After=network-online.target
ConditionFileNotEmpty=/etc/consul.d/consul.hcl

[Service]
Type=notify
User=consul
Group=consul
ExecStart=/usr/local/bin/consul agent -config-dir=/etc/consul.d/
ExecReload=/usr/local/bin/consul reload
KillMode=process
Restart=on-failure
LimitNOFILE=65536

[Install]
WantedBy=multi-user.target
The above runs the Consul binary, and looks to the /etc/consul.d/ directory for configuration
/etc/consul.d/consul.hcl
datacenter = "noisepalace"
data_dir = "/opt/consul"
encrypt = "${CONSUL_ENCRYPTION_KEY}"
retry_join = ["192.168.0.7"]
bind_addr = "192.168.0.7"

performance {
  raft_multiplier = 1
}
The bind_addr is statically set in this, because the server runs a number of Docker containers too, so Consul doesn’t know which interface to bind to without it. The retry_join parameter is used to discover the server. In this case, it is discovering itself, but the Consul server also runs the client too, so it needs to know how to contact the server.
To create the encryption key, use consul keygen. This key will be used by all your nodes in the “datacenter” (in this case, the confines of my house).
/etc/consul.d/server.hcl
server = true
bootstrap_expect = 1
ui = true
bind_addr = "192.168.0.7"
client_addr = "0.0.0.0"
In the above, the ui variable is used to enable the Consul Web UI. The bootstrap_expect variable is used to say how many servers are required to form the first Consul cluster. I have set it to 1, to allow a cluster with a single server.
The client_addr variable is used to say what address the API and UI listen on. In a production environment you will want to lock this down to one IP.
Client Configuration
The Client configuration is exactly the same as described in the Server Configuration section, except without the server.hcl file. You will want to change the bind_addr variable to the IP of the host it is running on (or remove it entirely if it only has one interface with an IP on).
Verification
After you have configured the cluster, you should be able to see something like this on the master: -
$ consul members
Node                        Address             Status  Type    Build  Protocol  DC           Segment
meshuggah                   192.168.0.7:8301    alive   server  1.6.1  2         noisepalace  <all>
config-01                   192.168.0.220:8301  alive   client  1.6.1  2         noisepalace  <default>
db-01                       192.168.0.229:8301  alive   client  1.6.1  2         noisepalace  <default>
exodus                      192.168.0.252:8301  alive   client  1.6.1  2         noisepalace  <default>
git-01                      192.168.0.223:8301  alive   client  1.6.1  2         noisepalace  <default>
ns-03                       192.168.0.221:8301  alive   client  1.6.1  2         noisepalace  <default>
teramaze                    192.168.0.236:8301  alive   client  1.6.1  2         noisepalace  <default>
testament                   192.168.0.253:8301  alive   client  1.6.1  2         noisepalace  <default>
vanhalen                    192.168.0.3:8301    alive   client  1.6.1  2         noisepalace  <default>
vektor                      192.168.0.251:8301  alive   client  1.6.1  2         noisepalace  <default>
vpn-01                      192.168.0.222:8301  alive   client  1.6.1  2         noisepalace  <default>
vps-shme                    192.168.100.1:8301  alive   client  1.6.1  2         noisepalace  <default>
vyos-01                     192.168.0.225:8301  alive   client  1.6.1  2         noisepalace  <default>
Excuse the mixed naming scheme, as I’m halfway between everything being named after bands (physical machines) and purpose (virtual machines). I will standardize at some point…
The Consul UI should also be available at this point, which you’ll be able to see at https://${YOUR-SERVER-IP}:8500/ui/
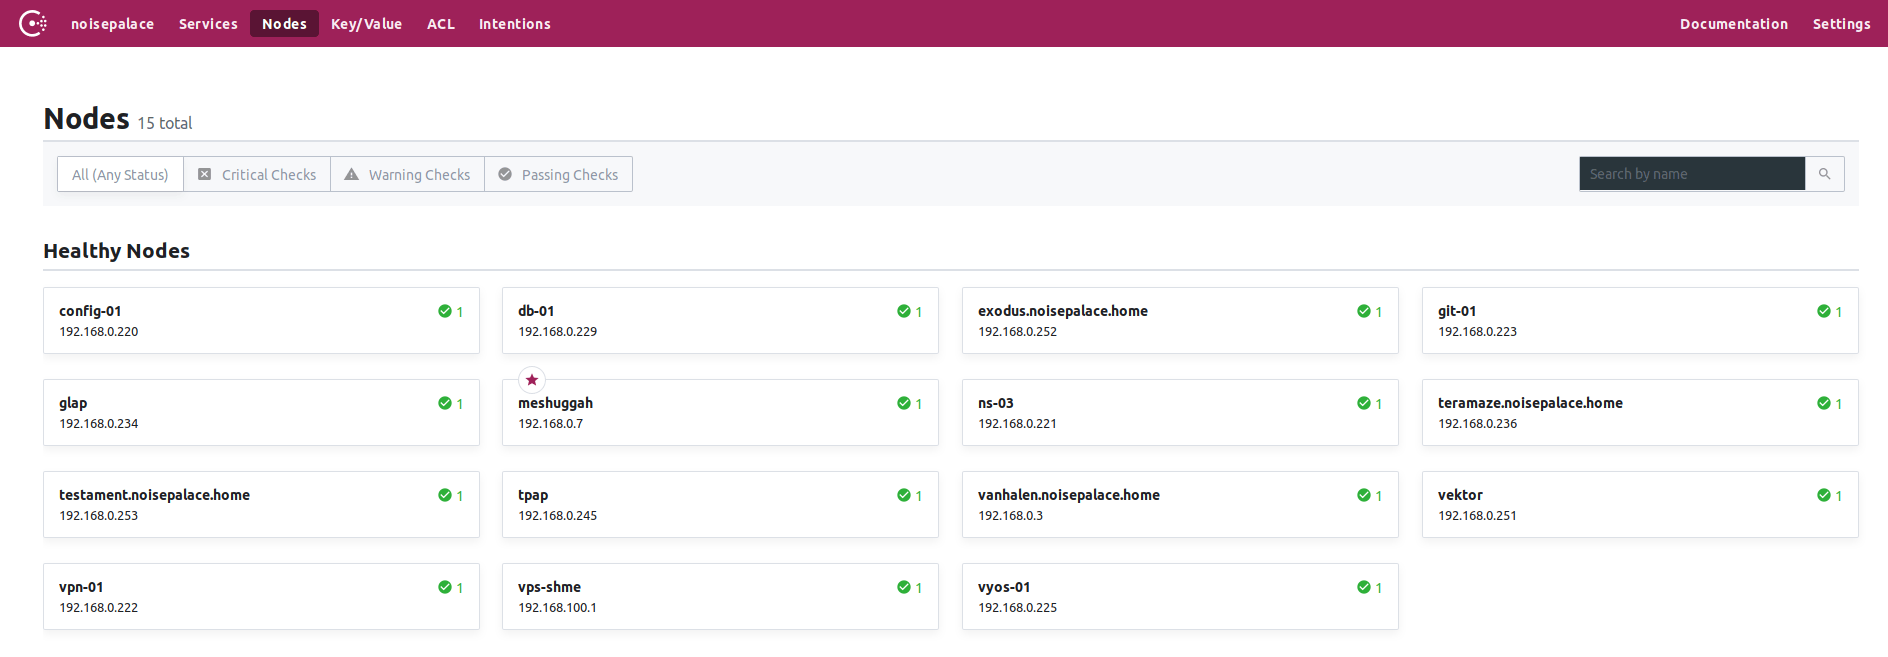
Where are my services?
Once Consul is setup, it needs to know about services you want to expose on each client. As noted, these can be added via the Consul CLI (using the consul service register directive), via the API, or using files in the Consul configuration directory.
To add a service via a file, it needs to be formatted something like the below: -
{
  "service":
  {"name": "node_exporter",
   "tags": ["node_exporter", "prometheus"],
   "port": 9100
  }
}
The tags are optional, but they are useful in identifying services. They can also be used to filter what services Prometheus will use (which I’ll explain later in this post).
If the above is added in your /etc/consul.d directory on your agents, you can then run consul reload for the new service to be picked up. The agent will then inform the Server that this service exists on this node.
$ consul catalog services
consul
node_exporter

$ consul catalog nodes -service=node_exporter
Node                        ID        Address        DC
config-01                   6652b349  192.168.0.220  noisepalace
db-01                       b403eac7  192.168.0.229  noisepalace
exodus.noisepalace.home     e378b4ed  192.168.0.252  noisepalace
git-01                      9f30a62e  192.168.0.223  noisepalace
glap                                  192.168.0.234  noisepalace
meshuggah                   2d6e78b5  192.168.0.7    noisepalace
ns-03                       e300899f  192.168.0.221  noisepalace
teramaze.noisepalace.home   c10a3be9  192.168.0.236  noisepalace
testament.noisepalace.home  0b1c0103  192.168.0.253  noisepalace
tpap                                  192.168.0.245  noisepalace
vanhalen.noisepalace.home   b74d9bd5  192.168.0.3    noisepalace
vektor                      ad374347  192.168.0.251  noisepalace
vpn-01                      15c80eaa  192.168.0.222  noisepalace
vps-shme                    9a29d4ca  192.168.100.1  noisepalace
vyos-01                     15659201  192.168.0.225  noisepalace
As the Agent is informing the Server of what services it has, rather than the Server defining what services exist on the agents, this forms the basis of automatic service discovery. It is no longer dependent on what a Server has configured.
Services without an agent
Not all services you will monitor can run an agent. For example, you can install a Node Exporter on OpenWRT (written in Lua rather than Go), but OpenWRT does not support running Consul.
To add external services, I have found adding them through the API is the easiest method.
Create a file that looks like the following: -
{
  "Node": "tpap",
  "Address": "192.168.0.245",
  "NodeMeta": {
    "external-node": "true",
    "external-probe": "true"
  },
  "Service": {
    "ID": "node_exporter",
    "Service": "node_exporter",
    "Tags": ["node_exporter", "prometheus"],
    "Port": 9100
  },
  "Checks": [
    {
      "Name": "http-check",
      "status": "passing",
      "Definition": {
        "http": "http://192.168.0.245:9100",
        "interval": "30s"
      }
    }
  ]
}
The above defines the External Node (in this case, an OpenWRT router), the service running on it, and a basic health check.
To apply this to Consul, run curl --request PUT --data @external.json localhost:8500/v1/catalog/register. This needs to run on one of your Consul servers.
Afterwards, the service will appear in your Consul catalog.
Prometheus Integration
To start making use of Consul with Prometheus, the prometheus.yml file will need updating with the details of your Consul server(s). An example configuration is below: -
global:
  scrape_interval:     15s # Set the scrape interval to every 15 seconds. Default is every 1 minute.
  evaluation_interval: 15s # Evaluate rules every 15 seconds. The default is every 1 minute.

scrape_configs:
  - job_name: 'prometheus'
    static_configs:
    - targets: ['localhost:9090']

  - job_name: 'consul'
    consul_sd_configs:
      - server: '192.168.0.7:8500'
    relabel_configs:
      - source_labels: [__meta_consul_tags]
        regex: .*,prometheus,.*
        action: keep
      - source_labels: [__meta_consul_service]
        target_label: job
The first job is the standard Prometheus endpoint. The second job however talks to Consul and retrieves the services.
As noted earlier, you can use Tags to filter what services are used. By default Consul adds the consul service into its catalog of existing services, which does not expose a Prometheus-compatible endpoint natively (it can be enabled, but it requires some changes to the default endpoint).
By using tags, you can filter out the Consul service. You can also have different scrape configurations for different kinds of jobs, while still using Consul for discovery of the services.
Different kinds of jobs?
A good example of where you might want to have different scrape configurations, using the Consul cluster, is something like the Blackbox Exporter. The exporter itself runs on a server, but it is effectively a proxy for HTTP(S), ICMP, DNS, TCP and UDP requests to an arbitrary list of endpoints (e.g. Google DNS, your ISP-provided home router, a Roku smart TV device etc).
The Blackbox Exporter configuration in Prometheus requires relabelling the endpoint you’re targeting to be proxied via the exporter itself, e.g.
  - job_name: 'blackbox'
    metrics_path: /probe
    params:
      module: [icmp_ipv4]
    static_configs:
      - targets:
        - 192.168.0.1
        - 192.168.0.3
        - 192.168.0.7
        - 192.168.0.40
        - 192.168.0.42
        - 192.168.0.220
    relabel_configs:
      - source_labels: [__address__]
        target_label: __param_target
      - source_labels: [__param_target]
        target_label: instance
      - target_label: __address__
        replacement: 127.0.0.1:9115
This style of configuration is different from what you’d require for the Node Exporter, hence you would use a different scrape job to get the endpoints from Consul.
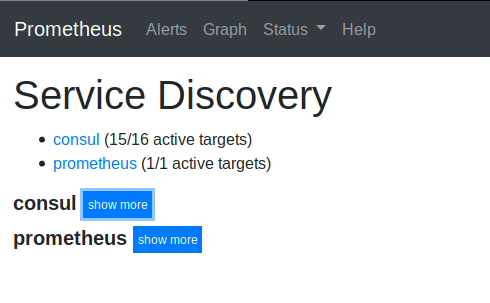
Prometheus Targets
Looking at the targets and service discovery section in the Prometheus UI, you’ll see the following when it scrapes from Consul
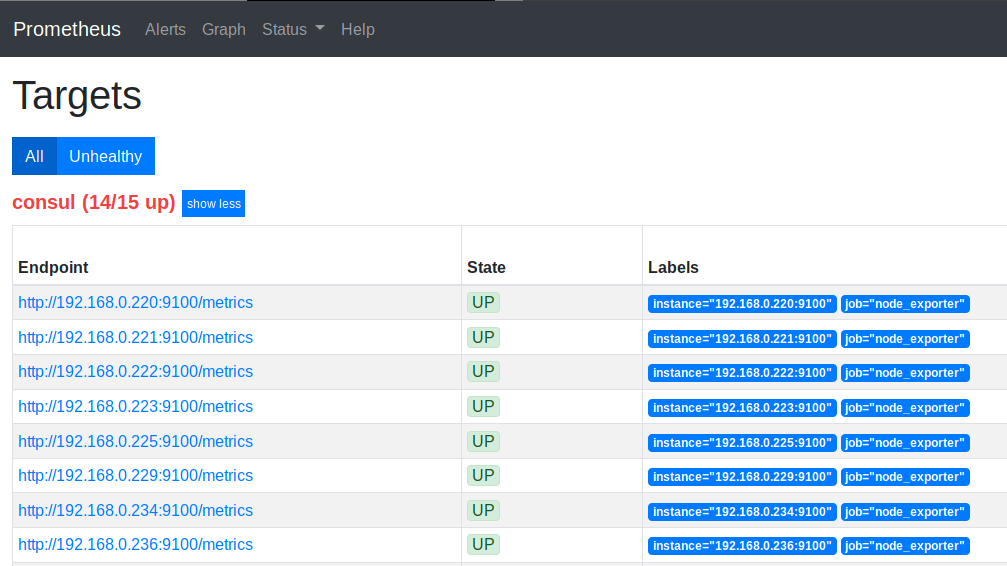
Now, whenever a new machine is added in my network (running Node Exporter and the Consul Agent), Prometheus will pick it up on it’s next scrape of Consul.
Services Discovered!
I’m still in the process of moving my home Prometheus setup to use Consul, but already I’m benefiting from it.
I’m also deploying Consul and the services via Salt rather than Ansible (although I’ll save that for another blog post…), meaning the moment a machine is added to the Salt master, it will soon be monitored by Prometheus. Perfect!
devops monitoring prometheus consul node_exporter
technical prometheus monitoring
1719 Words
2019-11-05 12:22 +0000