8 minutes
Prometheus: snmp_exporter and OpenBSD
In a previous post, I showed how to run the Prometheus node_exporter on a number of different operating systems, including OpenBSD.
Many OpenBSD installs are used as, or to replace, network appliances (e.g. peering routers, firewalls, VPN concentrators). Traditionally, you would monitor networking equipment using SNMP.
OpenBSDs snmpd(8) can expose a number of metrics that cover carp(4), pf(4), relayd(8) and more.
Prometheus and SNMP
The snmp_exporter is used so that Prometheus can monitor devices via SNMP. It functions as a “proxy”, with Prometheus targeting the snmp_exporter, informing it what devices to retrieve SNMP-based metrics from.
The snmp_exporter will then run an SNMP request on OIDs defined in a module. Within each module, you can define a small or large number of OIDs to check. It could be a mixture of multiple MIBs, or OIDs from a single MIB.
The snmp_exporter generator
The configuration that the snmp_exporter uses looks something like the below example: -
if_mib:
  auth:
    community: ### SNMP COMMUNITY ###
  walk:
  - 1.3.6.1.2.1.2
  - 1.3.6.1.2.1.31.1.1
  get:
  - 1.3.6.1.2.1.1.3.0
  metrics:
  - name: sysUpTime
    oid: 1.3.6.1.2.1.1.3
    type: gauge
    help: The time (in hundredths of a second) since the network management portion
      of the system was last re-initialized. - 1.3.6.1.2.1.1.3
  - name: ifNumber
    oid: 1.3.6.1.2.1.2.1
    type: gauge
    help: The number of network interfaces (regardless of their current state) present
      on this system. - 1.3.6.1.2.1.2.1
[...]
openbsd_pf:
  walk:
  - 1.3.6.1.4.1.30155.1.8.128
  get:
  - 1.3.6.1.4.1.30155.1.1.1.0
  - 1.3.6.1.4.1.30155.1.1.2.0
  - 1.3.6.1.4.1.30155.1.1.3.0
  - 1.3.6.1.4.1.30155.1.1.4.0
  - 1.3.6.1.4.1.30155.1.3.1.0
  - 1.3.6.1.4.1.30155.1.3.2.0
  - 1.3.6.1.4.1.30155.1.3.3.0
  - 1.3.6.1.4.1.30155.1.3.4.0
  metrics:
  - name: pfRunning
    oid: 1.3.6.1.4.1.30155.1.1.1
    type: gauge
    help: Indicates whether pf is enabled or not. - 1.3.6.1.4.1.30155.1.1.1
    enum_values:
      1: "true"
      2: "false"
[...]
The problem is, even for the most basic of MIBs and configurations, this could be thousands of lines long. For example, my configuration contains configuration for the basic IF-MIB (for general network statistics from a number of different kinds of devices), my MikroTik router, my Unifi APs and for gathering statistics from OpenBSD. How many lines of configuration does this entail?
$ cat snmp.yml | wc -l
7963
This is because each potential OID is contained in the configuration file, the type of metric we expect to return, and a useful description of what the OID is for. If lots of OIDs are being referenced, the size of the configuration will grow.
Thankfully, there is a tool called the generator, which takes a basic YAML configuration, detailing the OIDs, module name, authentication details, what SNMP version is to be used, and more.
For example, to generate configuration for an IF-MIB based module, you would use something like the following: -
modules:
  # Default IF-MIB interfaces table with ifIndex.
  if_mib:
    auth:
      community: ### SNMP-COMMUNITY ###
    walk: [sysUpTime, interfaces, ifXTable]
    lookups:
      - source_indexes: [ifIndex]
        lookup: ifAlias
      - source_indexes: [ifIndex]
        lookup: ifDescr
      - source_indexes: [ifIndex]
        # Use OID to avoid conflict with Netscaler NS-ROOT-MIB.
        lookup: 1.3.6.1.2.1.31.1.1.1.1 # ifName
    overrides:
      ifAlias:
        ignore: true # Lookup metric
      ifDescr:
        ignore: true # Lookup metric
      ifName:
        ignore: true # Lookup metric
      ifType:
        type: EnumAsInfo
The above comes from the snmp_exporter repository.
Full instructions on how to generate the configuration are available in the repository above, but as a quick summary: -
## Assuming you have a Golang environment set up
$ go get github.com/prometheus/snmp_exporter/generator
$ cp $GOPATH/bin/generator /usr/local/bin/
$ mkdir mibs
$ cd mibs

## Place your SNMP MIBs in the MIBs directory
$ cd ..
$ export MIBDIRS=mibs
$ generator generate
You will now find an snmp.yml configuration within the directory you ran then generator from.
Using the configuration
To use the generated snmp.yml, place it in a directory of your choice (I use /etc/prometheus), and reference it in your snmp_exporter command, e.g.
$ /usr/local/bin/snmp_exporter --config.file="/etc/prometheus/snmp.yml"
To get hold of snmp_exporter, go to the release page, download the correct release for your OS and architecture, and place it in a directory in your $PATH (I prefer /usr/local/bin).
Example OpenBSD configuration
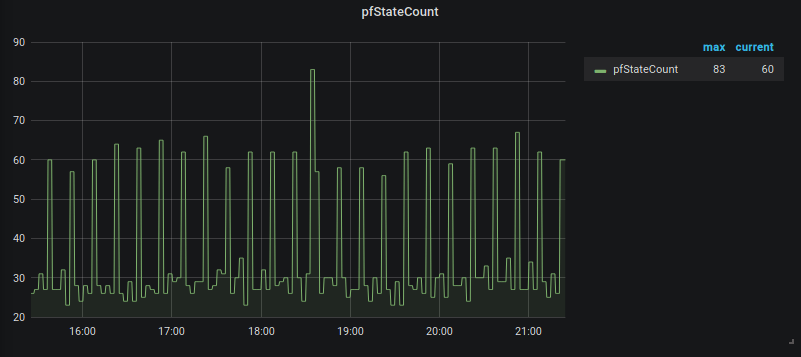
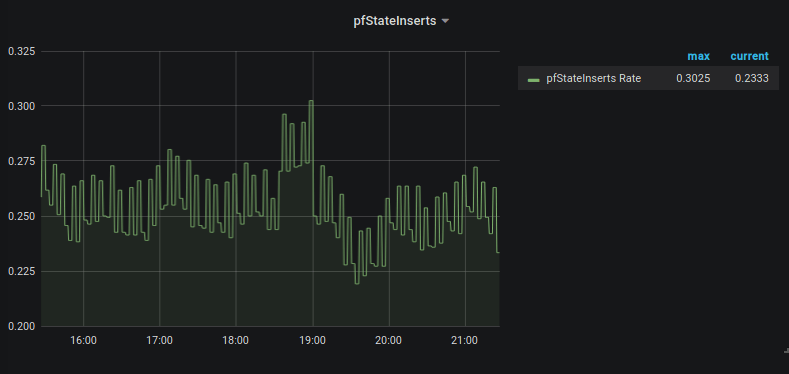
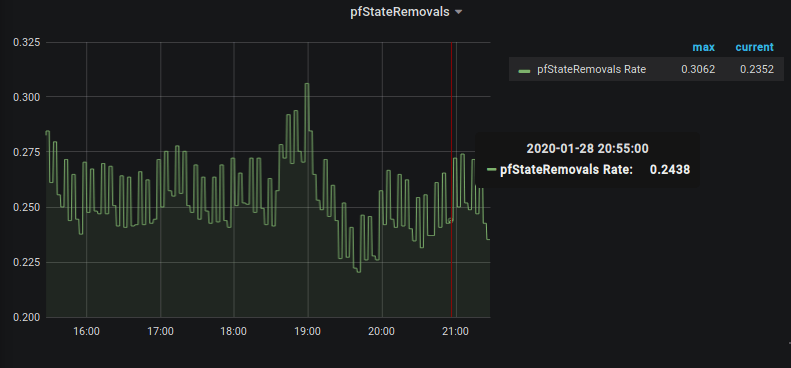
I am using snmp_exporter with OpenBSD to pull stats for pf(4). This includes the number of states, state inserts and removals, and other useful information.
On OpenBSD itself, the snmpd(8) configuration (/etc/snmpd.conf) looks like the below: -
## $OpenBSD: snmpd.conf,v 1.1 2014/07/11 21:20:10 deraadt Exp $

listen_addr="192.168.10.250"

## Restrict daemon to listen on localhost only
listen on $listen_addr

## Specify a number of trap receivers
##trap receiver nms.localdomain.local

## Adjust the local system information
system contact "Stuart"
system description "bastion-01"
system location "Home"
system services 74

## Enable SNMPv3 USM with authentication, encryption and two defined users
seclevel enc
user "$SNMPv3-USER" authkey "$SNMP-AUTH-KEY" enc aes enckey "$SNMP-ENCRYPTION-KEY"
The generator.yml configuration looks like the below: -
modules:
  openbsd_pf:
    walk:
      - pfRunning
      - pfRuntime
      - pfDebug
      - pfHostid
      - pfStateCount
      - pfStateSearches
      - pfStateInserts
      - pfStateRemovals
      - pfIfTable
      - pfIfDescr
      - pfIfType
      - pfIfIndex
    version: 3
    lookups:
    - source_indexes: [pfIfIndex]
      lookup: pfIfDescr
      drop_source_indexes: false
    auth:
      username: $SNMPv3-USER
      security_level: authPriv
      password: "$SNMP-AUTH-KEY"
      auth_protocol: SHA
      priv_protocol: AES
      priv_password: "$SNMP-ENCRYPTION-KEY"
Note that I’m using SNMPv3 here. This means I need to supply authentication and encryption keys, as well as what authentication and encryption protocols are in use. By default, snmpd(8) uses SHA-1 as it’s hashing algorithm for authentication. If you specify MD5, the snmp_exporter will not be able to run SNMP queries against the OpenBSD machine.
The OIDs I have chosen are the ones that I deemed most useful to my use case.
I have also added a lookup section, which will add the pf(4) interface name to any label that already contains the pfIfIndex. This means that most of the metrics will also return the name of the interface they are relevant to.
Again, run the following to generate the configuration
$ mkdir mibs
$ cd mibs
$ wget $MIB-URL
$ cd ..
$ generator generate
Where do I get the MIBs from?
For OpenBSD, you can get hold of the MIBs from here.
A number of operating systems also come with their own utilities for retrieving SNMP MIBs (e.g. Debian’s snmp-mibs-downloader).
Also, if you follow the instructions on the generator section for the snmp_exporter, it will download a number of MIBs that cover everything in the example snmp.yml file provided in the repository.
Using the OpenBSD configuration
As shown previously, you would use the configuration like so: -
$ /usr/local/bin/snmp_exporter --config.file="/etc/prometheus/snmp.yml"
You can then reference this as a target in your Prometheus configuration file: -
  - job_name: openbsd_pf_snmp
    scrape_interval: 180s
    metrics_path: /snmp
    params:
      module: [openbsd_pf]
    relabel_configs:
     - source_labels: [__address__]
       target_label: __param_target
     - source_labels: [__param_target]
       target_label: instance
     - target_label: __address__
       replacement: 127.0.0.1:9116
    static_configs:
      - targets:
        - $IP-OF-OPENBSD-INSTANCE
One point to note is that using the default Prometheus scrape intervals (usually around 15s) can generate a large amount of SNMP requests that can overwhelm some machines.
I have raised the scrape interval to 180s (3 minutes) in the example above, to avoid placing unnecessary load on the machines. Play around with this value until you find a level you are happy with, taking into account the longer the scrape interval, the less granularity you will have on your metrics.
In action
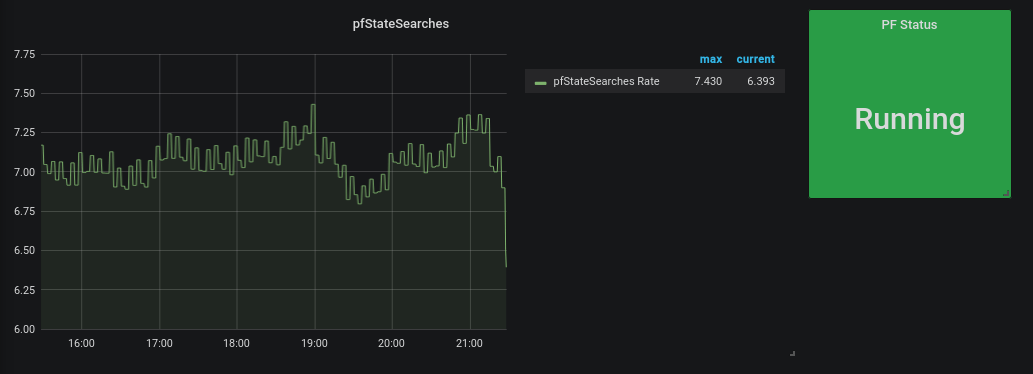
Below are some Grafana graphs showing the kind of stats you can get out of using snmp_exporter with OpenBSD
Query: pfStateCount

Query: rate(pfStateInserts[30m])

Query: rate(pfStateRemovals[30m])

Query: rate(pfStateSearches[30m])

In the last, I also added a Single Stat panel that uses the pfRunning query, with some value mappings (1 to Running, 0 to Not Running)
To see all the available metrics, you can run something like curl http://###IP-OF-SNMP-EXPORTER###:9116/snmp?target=###IP-OF-OPENBSD-MACHINE###&module=openbsd_pf, where you’ll see an output like the following: -
# HELP pfDebug Indicates the debug level that pf is running at. - 1.3.6.1.4.1.30155.1.1.3
# TYPE pfDebug gauge
pfDebug 3
# HELP pfHostid The (unique) host id of the machine running pf. - 1.3.6.1.4.1.30155.1.1.4
# TYPE pfHostid gauge
pfHostid{pfHostid="0xcd2bf746"} 1
# HELP pfIfDescr The name of the interface. - 1.3.6.1.4.1.30155.1.8.128.1.2
# TYPE pfIfDescr gauge
pfIfDescr{pfIfDescr="all",pfIfIndex="1"} 1
pfIfDescr{pfIfDescr="carp",pfIfIndex="2"} 1
pfIfDescr{pfIfDescr="egress",pfIfIndex="3"} 1
pfIfDescr{pfIfDescr="enc",pfIfIndex="4"} 1
pfIfDescr{pfIfDescr="enc0",pfIfIndex="5"} 1
pfIfDescr{pfIfDescr="lo",pfIfIndex="6"} 1
pfIfDescr{pfIfDescr="lo0",pfIfIndex="7"} 1
pfIfDescr{pfIfDescr="pflog",pfIfIndex="8"} 1
pfIfDescr{pfIfDescr="pflog0",pfIfIndex="9"} 1
pfIfDescr{pfIfDescr="vio0",pfIfIndex="10"} 1
pfIfDescr{pfIfDescr="vio1",pfIfIndex="11"} 1
# HELP pfIfIn4BlockBytes The number of incoming IPv4 bytes blocked. - 1.3.6.1.4.1.30155.1.8.128.1.9
# TYPE pfIfIn4BlockBytes counter
pfIfIn4BlockBytes{pfIfDescr="all",pfIfIndex="1"} 0
pfIfIn4BlockBytes{pfIfDescr="carp",pfIfIndex="2"} 0
pfIfIn4BlockBytes{pfIfDescr="egress",pfIfIndex="3"} 0
[...]
The machine I am running this against does not usually experience high traffic levels. It functions bastion host rather than a dedicated firewall, so the statistics are not particularly large.
If you are running this against dedicated firewalls, the stats you can retrieve will be invaluable.
Why use snmp_exporter over other tools?
The snmp_exporter can give you great insight into your infrastructure. However it can be quite daunting, especially when you first look at the snmp.yml configuration that the Generator creates.
If you are coming from monitor systems like LibreNMS, Solarwinds or other Network-focussed monitoring systems, you will have probably been spoiled by how easy it is to add devices (often just adding the hostname/IP address, and the relevant SNMP community/authentication details).
However it is also worth nothing that with the aforementioned monitoring systems, a lot of work has gone into the discovery mechanisms when adding new devices.
Also, especially with commercial/closed-source systems, getting new devices and/or new MIBs added can take time, or may never happen.
For example, at a previous workplace, our monitoring system was a closed-source offering. Despite numerous attempts to get CheckPoint Virtual Systems (VSX) working with it, the vendor never added the capabilities, or the relevant MIBs to be able to query customer Virtual Systems. If we had used something like Prometheus and snmp_exporter, we could have just generated the relevant snmp.yml file from the CheckPoint MIBs, and started monitoring them straight away.
The flexibility in being able define the OIDs you are interested in, as well as being able to use practically any MIB in existence, are why I would consider using the snmp_exporter over other tools.
Summary
I am hoping this article helps people get to grips with using SNMP checks with Prometheus, and specifically with OpenBSD’s pf(4).
The approach shown can be used with just about any MIBs you can get hold of, from Cisco Wireless LAN Controllers to Raritan PDUs.
devops monitoring prometheus openbsd snmp_exporter
technical prometheus monitoring
1651 Words
2020-01-28 19:53 +0000