15 minutes
Prometheus - Using Service Discovery with Digital Ocean
Recently I put together a post on using Prometheus to discover services within AWS, Azure and the Google Cloud Platform. Not long after publishing this post, I saw that service discovery for Digital Ocean is now available within Prometheus as well.
This feature is not in the published version as of yet (2.19.2 at the time of writing), so you will need to do one of the following: -
- If you are using Docker, use the
:mastertag (e.g.docker pull prom/prometheus:master) - Build it from source
Because this feature is not in a general released version, the service discovery mechanism may change at a later date. If it does, I will update this post to reflect that.
Building from source
To build Prometheus from source, you will need to make sure you have a working Golang (v1.13 or above) environment, as well as installing NodeJS and Yarn. To prepare an Ubuntu 20.04 instance for this, do the following: -
# Install Golang
$ apt install golang

# Install NodeJS and NPM (Node Package Manager)
$ apt install nodejs npm

# Install Yarn
$ npm install -g npm

# Set your GOPATH
$ mkdir ~/go
$ export GOPATH=~/go
After this, you can follow the instructions provided on the Prometheus GitHub README. These are: -
$ mkdir -p $GOPATH/src/github.com/prometheus
$ cd $GOPATH/src/github.com/prometheus
$ git clone https://github.com/prometheus/prometheus.git
$ cd prometheus
$ make build
This process generates all the web assets (using NodeJS and Yarn), as well as injecting them into the Golang build process. This makes the binary portable (i.e. the web assets are part of the binary, rather than in a static path). The output of the make build command is below: -
cd web/ui/react-app && yarn --frozen-lockfile
yarn install v1.22.4
[1/4] Resolving packages...
[2/4] Fetching packages...
info [email protected]: The platform "linux" is incompatible with this module.
info "[email protected]" is an optional dependency and failed compatibility check. Excluding it from installation.
info [email protected]: The platform "linux" is incompatible with this module.
info "[email protected]" is an optional dependency and failed compatibility check. Excluding it from installation.
[3/4] Linking dependencies...
warning " > [email protected]" has unmet peer dependency "[email protected]".
[4/4] Building fresh packages...
Done in 47.65s.
>> building React app
building React app
yarn run v1.22.4
$ react-scripts build
Creating an optimized production build...
Compiled successfully.

File sizes after gzip:

  260.61 KB  build/static/js/2.dfe05a07.chunk.js
  29.67 KB   build/static/js/main.3085a125.chunk.js
  23.27 KB   build/static/css/2.df42c974.chunk.css
  1.5 KB     build/static/css/main.0b010d50.chunk.css
  770 B      build/static/js/runtime-main.5db206b5.js

The project was built assuming it is hosted at ./.
You can control this with the homepage field in your package.json.

The build folder is ready to be deployed.

Find out more about deployment here:

  bit.ly/CRA-deploy

Done in 70.80s.
>> writing assets
# Un-setting GOOS and GOARCH here because the generated Go code is always the same,
# but the cached object code is incompatible between architectures and OSes (which
# breaks cross-building for different combinations on CI in the same container).
cd web/ui && GO111MODULE=on GOOS= GOARCH= go generate -x -v  -mod=vendor
doc.go
go run -mod=vendor assets_generate.go
writing assets_vfsdata.go
ui.go
curl -s -L https://github.com/prometheus/promu/releases/download/v0.5.0/promu-0.5.0.linux-amd64.tar.gz | tar -xvzf - -C /tmp/tmp.Zr9ksLsvhC
promu-0.5.0.linux-amd64/
promu-0.5.0.linux-amd64/promu
promu-0.5.0.linux-amd64/NOTICE
promu-0.5.0.linux-amd64/LICENSE
mkdir -p /home/$USER/go/bin
cp /tmp/tmp.Zr9ksLsvhC/promu-0.5.0.linux-amd64/promu /home/$USER/go/bin/promu
rm -r /tmp/tmp.Zr9ksLsvhC
>> building binaries
GO111MODULE=on /home/$USER/go/bin/promu build --prefix /home/$USER/go/src/github.com/prometheus/prometheus
 >   prometheus
 >   promtool
 >   tsdb
This will generate the prometheus binary, as well as promtool. You can use this prometheus binary in place of your existing one. For me, this would be /usr/local/bin/prometheus.
Do note that as this is an unreleased version, you may encounter bugs that are not in the official published versions.
Terraform
Now that we have a Prometheus binary that can discover services in DigitalOcean, we can define our Digital Ocean resources in Terraform. For information on how to install Terraform and the project structure, see here.
Digital Ocean
Digital Ocean offer a variety of services, from cloud instances (virtual machines), databases, object storage, load balancers and managed Kubernetes. While they the size of AWS, Azure or Google Cloud Platform, they still have a significant user base (myself being one of them!)
Cloud Instances within Digital Ocean are known as Droplets. The smallest Droplet comes with 1 vCPU and 1G of memory, with the largest at 32 vCPUs and 192G of memory.
You can sign up for a DigitalOcean account here. As a point of note, if you listen to podcasts in the Linux and Open Source community, you’ll probably hear offers to get $100 of credit for 60 days, so be sure to use one of these if you can.
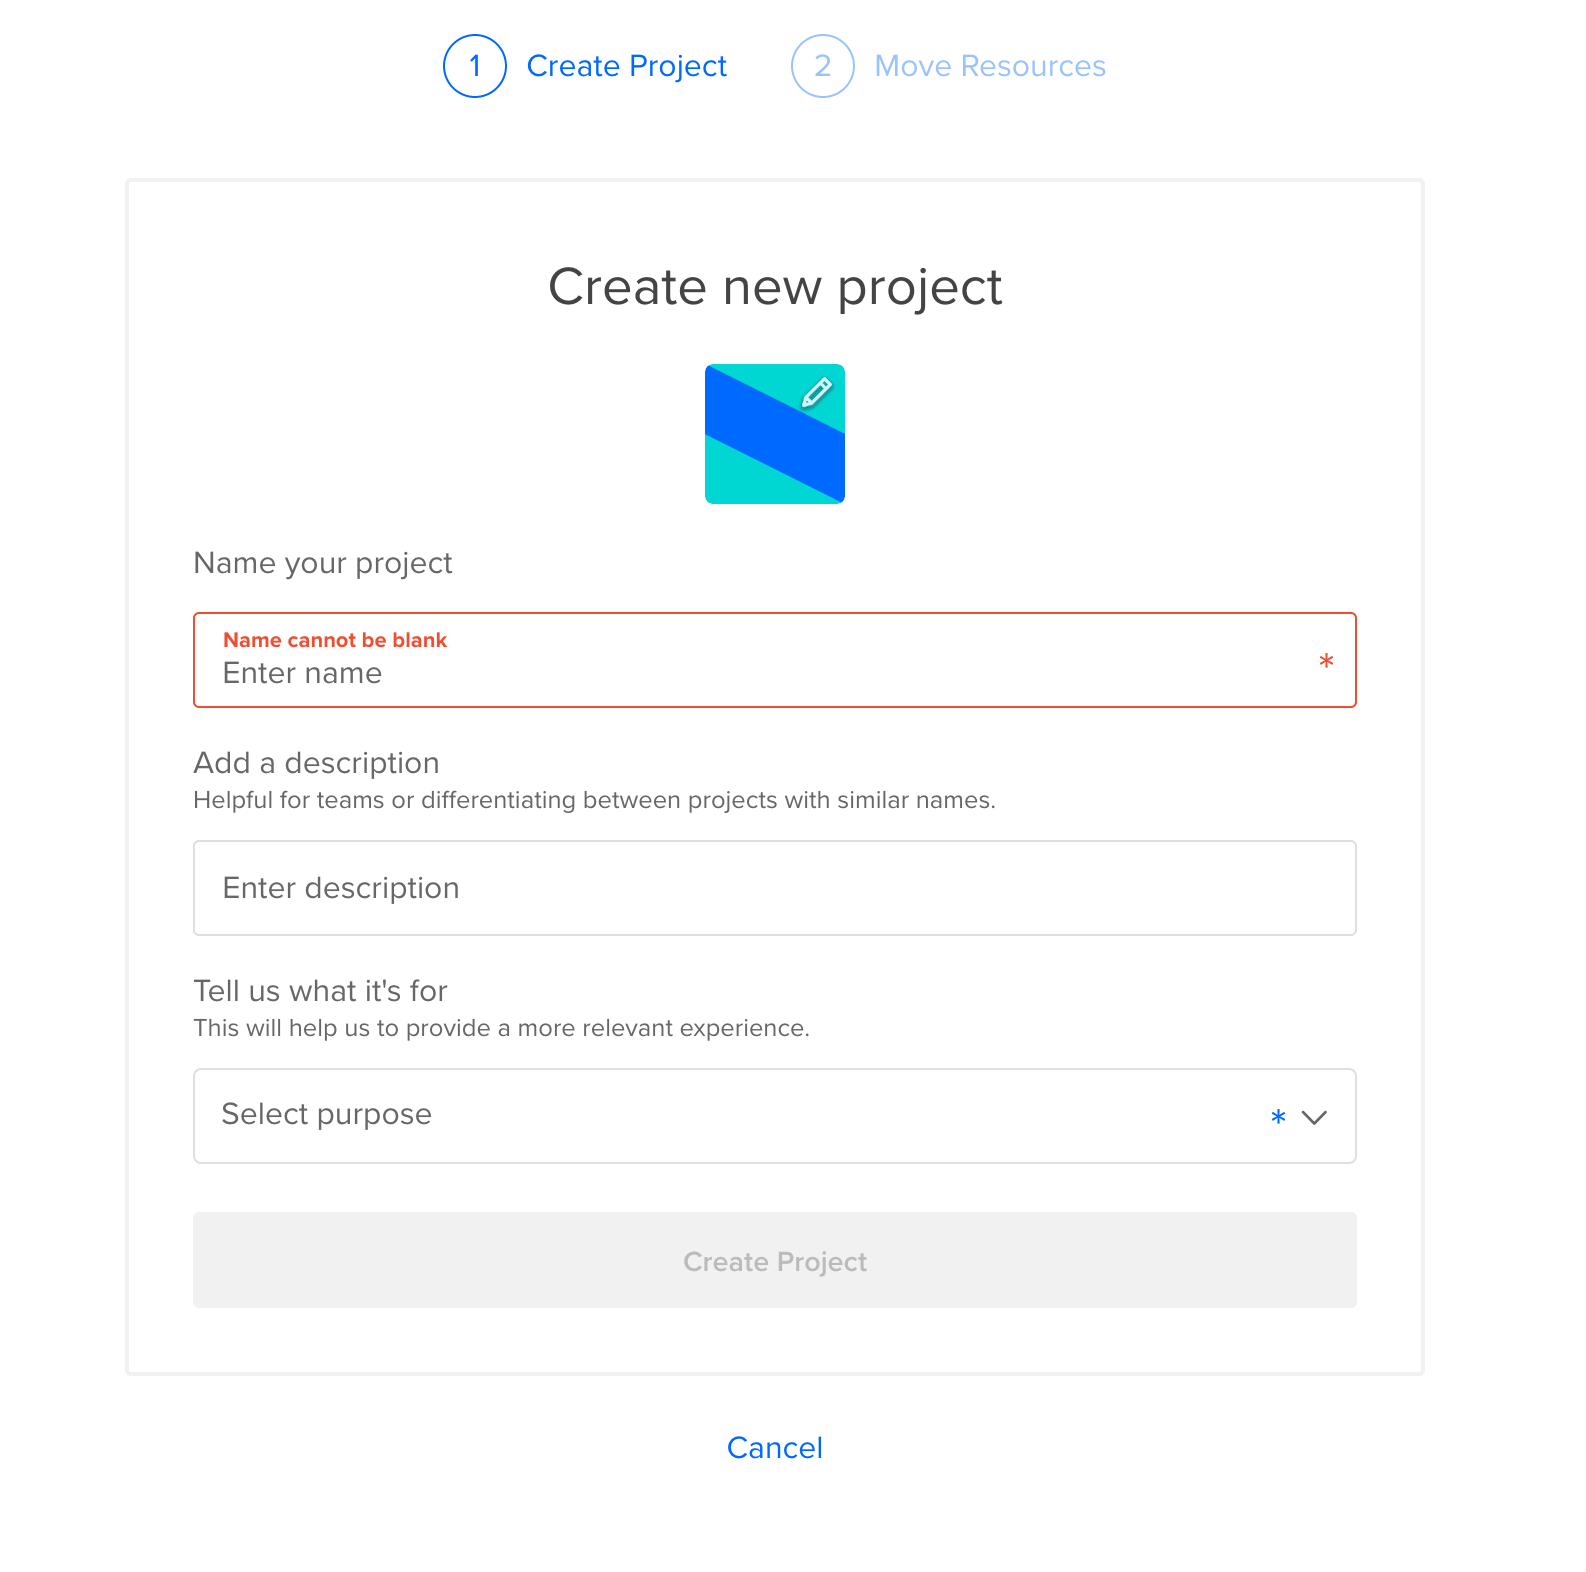
Once you have signed up, you’ll be asked to create a project. This is a container for your resources, allowing you to group them together as you see fit: -
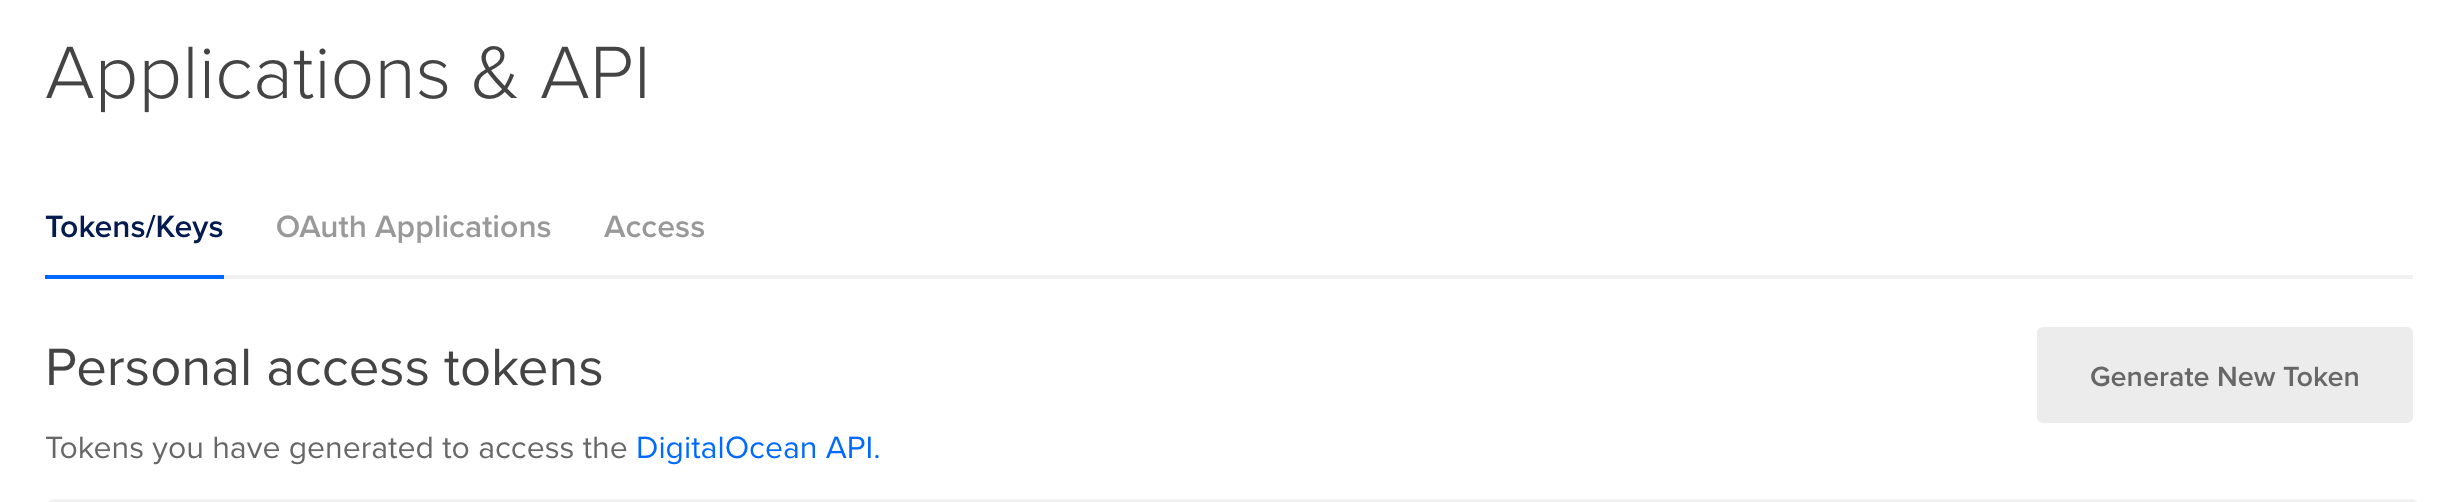
Create an API key
Terraform uses Digital Ocean API keys to authenticate and provision resources. You can generate a key in the API section of the Digital Ocean Cloud Console: -
You can choose to either: -
- Configure the API token as a variable in Terraform
- Expose it as an environment variable
To configure it as a variable in Terraform, do something like the following (taken from the Terraform Digital Ocean Provider page): -
# Set the variable value in *.tfvars file
# or using -var="do_token=..." CLI option
variable "do_token" {
  type = "string"
  default = "$TOKEN_GOES_HERE"
}

# Configure the DigitalOcean Provider
provider "digitalocean" {
  token = var.do_token
}
Alternatively, Terraform will use the environment variables $DIGITALOCEAN_TOKEN or $DIGITALOCEAN_ACCESS_TOKEN. You can set this with export DIGITALOCEAN_TOKEN="###API-KEY### or you can place them in your .bashrc or .zshrc to be loaded when you open a terminal.
Configure Terraform - Droplets
Now that we have an API key created and available, we can use Terraform with Digital Ocean.
In your chosen directory to define your infrastructure (I am using ~/terraform/basic-vms for this), create a providers.tf file that contains the following: -
# Digital Ocean Provider

provider "digitalocean" {
}
The above discovers the Digital Ocean API Key from our environment variables ($DIGITALOCEAN_TOKEN in my case). No other details are required at this stage.
After this, run terraform init. This downloads the Digital Ocean Terraform provider binary: -
Initializing the backend...

Initializing provider plugins...
- Checking for available provider plugins...
- Downloading plugin for provider "digitalocean" (terraform-providers/digitalocean) 1.20.0...
- Downloading plugin for provider "template" (hashicorp/template) 2.1.2...

The following providers do not have any version constraints in configuration,
so the latest version was installed.

To prevent automatic upgrades to new major versions that may contain breaking
changes, it is recommended to add version = "..." constraints to the
corresponding provider blocks in configuration, with the constraint strings
suggested below.

* provider.digitalocean: version = "~> 1.20"
* provider.template: version = "~> 2.1"

Terraform has been successfully initialized!

You may now begin working with Terraform. Try running "terraform plan" to see
any changes that are required for your infrastructure. All Terraform commands
should now work.

If you ever set or change modules or backend configuration for Terraform,
rerun this command to reinitialize your working directory. If you forget, other
commands will detect it and remind you to do so if necessary.
The template provider is because we use it for user-data (i.e. first-time boot configuration). This is covered in the AWS EC2s section of the previous post on Cloud service discovery.
Define the infrastructure - Droplets
You can now create the configuration files for your first Droplet. The below is from the file do.tf in the terraform/basic-vms directory: -
resource "digitalocean_droplet" "yetiops-prom-vm" {
  image              = "ubuntu-20-04-x64"
  name               = "yetiops-prom-vm"
  region             = "fra1"
  size               = "s-1vcpu-1gb"
  ssh_keys           = [digitalocean_ssh_key.yetiops-ssh-key.fingerprint]

  tags = [
    digitalocean_tag.prometheus.id,
    digitalocean_tag.node_exporter.id
  ]

  user_data          = data.template_file.ubuntu.template

}

resource "digitalocean_tag" "prometheus" {
  name = "prometheus"
}

resource "digitalocean_tag" "node_exporter" {
  name = "node_exporter"
}

resource "digitalocean_ssh_key" "yetiops-ssh-key" {
  name       = "SSH Key"
  public_key = file("~/.ssh/id_ed25519.pub")
}

resource "digitalocean_firewall" "yetiops-prom-vm" {
  name = "yetiops-prom-vm"

  droplet_ids = [digitalocean_droplet.yetiops-prom-vm.id]

  inbound_rule {
    protocol         = "tcp"
    port_range       = "22"
    source_addresses = ["$MY_PUBLIC_IP/32"]
  }

  inbound_rule {
    protocol         = "tcp"
    port_range       = "9100"
    source_addresses = ["$MY_PUBLIC_IP/32"]
  }

  inbound_rule {
    protocol         = "icmp"
    source_addresses = ["0.0.0.0/0", "::/0"]
  }

  outbound_rule {
    protocol              = "icmp"
    destination_addresses = ["0.0.0.0/0", "::/0"]
  }

  outbound_rule {
    protocol              = "tcp"
    port_range            = "1-65535"
    destination_addresses = ["0.0.0.0/0", "::/0"]
  }

  outbound_rule {
    protocol              = "udp"
    port_range            = "1-65535"
    destination_addresses = ["0.0.0.0/0", "::/0"]
  }
}
To summarize what we are doing here, we are: -
- Creating a Digital Ocean Droplet, running Ubuntu 20.04, of size
s-1vcpu-1gb(1 vCPU, 1G of memory) - Using the Ubuntu template file for
user-data(which is a cloud-config file that installs the Prometheus Node Exporter and nothing more) - Creating two tags (
prometheusandnode_exporter) and attaching them to the Droplet - Adding a local SSH key to Digital Ocean so that we can SSH into the instance once it is provisioned
- Creating a firewall that allows SSH and the Node Exporter port inbound from my public IP, any ICMP (i.e. Ping) traffic, and all outbound traffic
Unlike tags in AWS and Azure, and labels in Google Cloud Platform, Digital Ocean tags are not $KEY:$VALUE based (i.e. prometheus: true). This is something to be aware of when configuring Prometheus later.
Build the infrastructure - Droplets
We can now apply our configuration, and see if it builds a Digital Ocean Droplet: -
$ terraform apply
data.template_file.ubuntu: Refreshing state...
data.template_cloudinit_config.ubuntu: Refreshing state...

An execution plan has been generated and is shown below.
Resource actions are indicated with the following symbols:
  + create

Terraform will perform the following actions:

  # digitalocean_droplet.yetiops-prom-vm will be created
  + resource "digitalocean_droplet" "yetiops-prom-vm" {
      + backups              = false
      + created_at           = (known after apply)
      + disk                 = (known after apply)
      + id                   = (known after apply)
      + image                = "ubuntu-20-04-x64"
      + ipv4_address         = (known after apply)
      + ipv4_address_private = (known after apply)
      + ipv6                 = false
      + ipv6_address         = (known after apply)
      + ipv6_address_private = (known after apply)
      + locked               = (known after apply)
      + memory               = (known after apply)
      + monitoring           = false
      + name                 = "yetiops-prom-vm"
      + price_hourly         = (known after apply)
      + price_monthly        = (known after apply)
      + private_networking   = (known after apply)
      + region               = "fra1"
      + resize_disk          = true
      + size                 = "s-1vcpu-1gb"
      + ssh_keys             = (known after apply)
      + status               = (known after apply)
      + tags                 = (known after apply)
      + urn                  = (known after apply)
      + user_data            = "2169d8a3e100623d34bf1a7b2f6bd924a8997bfb"
      + vcpus                = (known after apply)
      + volume_ids           = (known after apply)
      + vpc_uuid             = (known after apply)
    }

  # digitalocean_firewall.yetiops-prom-vm will be created
  + resource "digitalocean_firewall" "yetiops-prom-vm" {
      + created_at      = (known after apply)
      + droplet_ids     = (known after apply)
      + id              = (known after apply)
      + name            = "yetiops-prom-vm"
      + pending_changes = (known after apply)
      + status          = (known after apply)

      + inbound_rule {
          + protocol                  = "icmp"
          + source_addresses          = [
              + "0.0.0.0/0",
              + "::/0",
            ]
          + source_droplet_ids        = []
          + source_load_balancer_uids = []
          + source_tags               = []
        }
      + inbound_rule {
          + port_range                = "22"
          + protocol                  = "tcp"
          + source_addresses          = [
              + "$MY_PUBLIC_IP/32",
            ]
          + source_droplet_ids        = []
          + source_load_balancer_uids = []
          + source_tags               = []
        }
      + inbound_rule {
          + port_range                = "9100"
          + protocol                  = "tcp"
          + source_addresses          = [
              + "$MY_PUBLIC_IP/32",
            ]
          + source_droplet_ids        = []
          + source_load_balancer_uids = []
          + source_tags               = []
        }

      + outbound_rule {
          + destination_addresses          = [
              + "0.0.0.0/0",
              + "::/0",
            ]
          + destination_droplet_ids        = []
          + destination_load_balancer_uids = []
          + destination_tags               = []
          + protocol                       = "icmp"
        }
      + outbound_rule {
          + destination_addresses          = [
              + "0.0.0.0/0",
              + "::/0",
            ]
          + destination_droplet_ids        = []
          + destination_load_balancer_uids = []
          + destination_tags               = []
          + port_range                     = "1-65535"
          + protocol                       = "tcp"
        }
      + outbound_rule {
          + destination_addresses          = [
              + "0.0.0.0/0",
              + "::/0",
            ]
          + destination_droplet_ids        = []
          + destination_load_balancer_uids = []
          + destination_tags               = []
          + port_range                     = "1-65535"
          + protocol                       = "udp"
        }
    }

  # digitalocean_ssh_key.yetiops-ssh-key will be created
  + resource "digitalocean_ssh_key" "yetiops-ssh-key" {
      + fingerprint = (known after apply)
      + id          = (known after apply)
      + name        = "SSH Key"
      + public_key  = "$SSH_PUBLIC_KEY_CONTENTS"
    }

  # digitalocean_tag.node_exporter will be created
  + resource "digitalocean_tag" "node_exporter" {
      + databases_count        = (known after apply)
      + droplets_count         = (known after apply)
      + id                     = (known after apply)
      + images_count           = (known after apply)
      + name                   = "node_exporter"
      + total_resource_count   = (known after apply)
      + volume_snapshots_count = (known after apply)
      + volumes_count          = (known after apply)
    }

  # digitalocean_tag.prometheus will be created
  + resource "digitalocean_tag" "prometheus" {
      + databases_count        = (known after apply)
      + droplets_count         = (known after apply)
      + id                     = (known after apply)
      + images_count           = (known after apply)
      + name                   = "prometheus"
      + total_resource_count   = (known after apply)
      + volume_snapshots_count = (known after apply)
      + volumes_count          = (known after apply)
    }

Plan: 5 to add, 0 to change, 0 to destroy.

Do you want to perform these actions?
  Terraform will perform the actions described above.
  Only 'yes' will be accepted to approve.

  Enter a value: yes

digitalocean_tag.prometheus: Creating...
digitalocean_tag.node_exporter: Creating...
digitalocean_ssh_key.yetiops-ssh-key: Creating...
digitalocean_tag.prometheus: Creation complete after 1s [id=prometheus]
digitalocean_ssh_key.yetiops-ssh-key: Creation complete after 1s [id=27810953]
digitalocean_tag.node_exporter: Creation complete after 1s [id=node_exporter]
digitalocean_droplet.yetiops-prom-vm: Creating...
digitalocean_droplet.yetiops-prom-vm: Still creating... [10s elapsed]
digitalocean_droplet.yetiops-prom-vm: Still creating... [20s elapsed]
digitalocean_droplet.yetiops-prom-vm: Still creating... [30s elapsed]
digitalocean_droplet.yetiops-prom-vm: Creation complete after 35s [id=197944957]
digitalocean_firewall.yetiops-prom-vm: Creating...
digitalocean_firewall.yetiops-prom-vm: Creation complete after 0s [id=180b6bd2-ee0c-4649-bae5-9cb2d3db6473]

Apply complete! Resources: 5 added, 0 changed, 0 destroyed.
We can double check that Terraform is managing these resources now with terraform state list: -
$ terraform state list
data.template_cloudinit_config.ubuntu
data.template_file.ubuntu
digitalocean_droplet.yetiops-prom-vm
digitalocean_firewall.yetiops-prom-vm
digitalocean_ssh_key.yetiops-ssh-key
digitalocean_tag.node_exporter
digitalocean_tag.prometheus
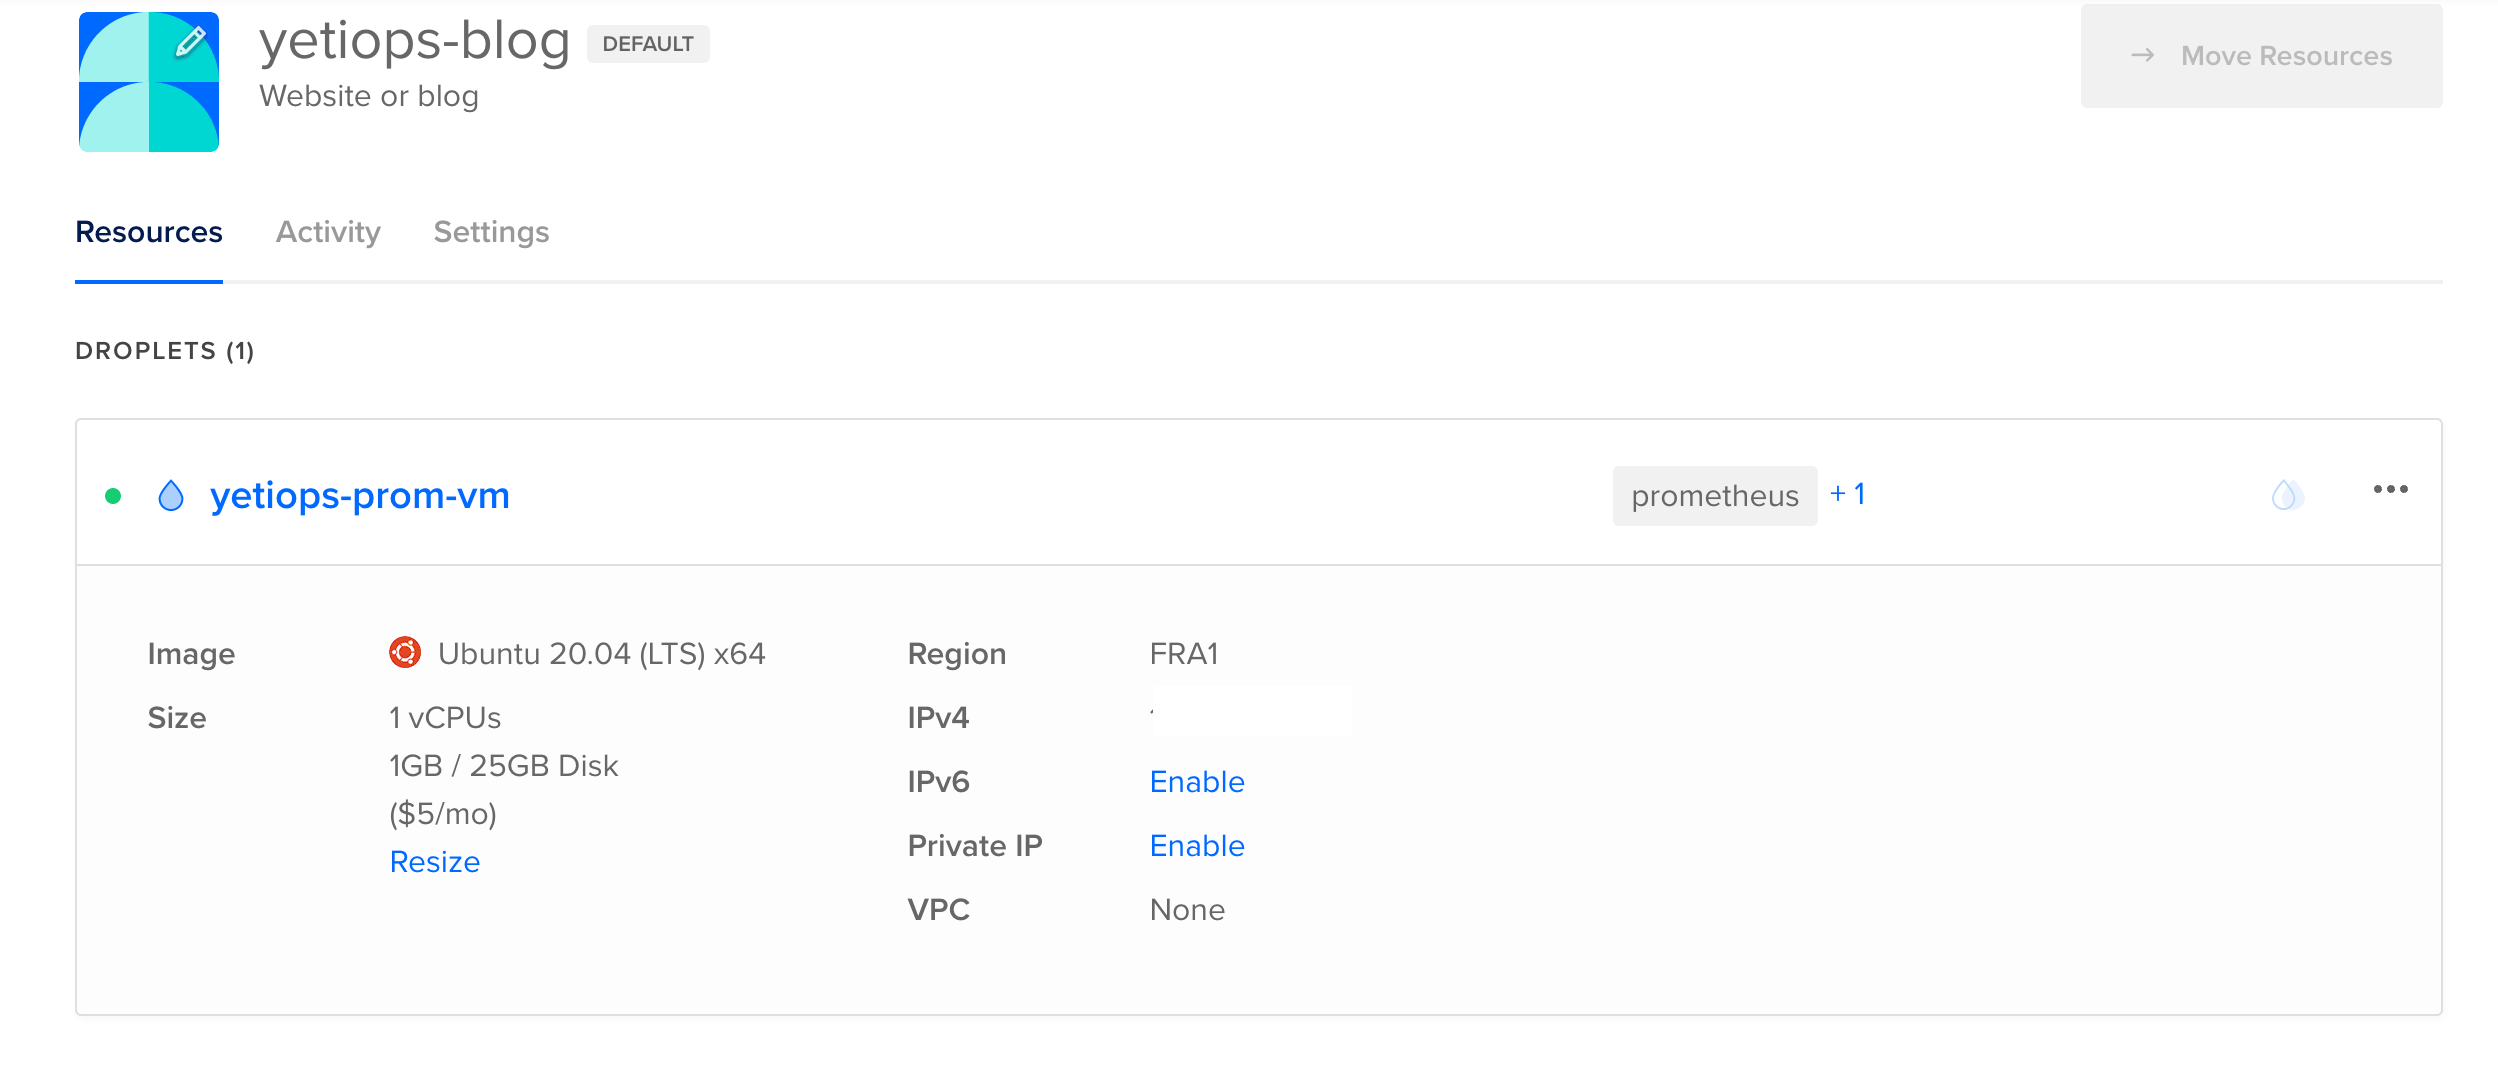
We can check to see if the instance is in the Digital Ocean Console: -
Now lets try SSH: -
$ ssh root@$DROPLET_PUBLIC_IP
Welcome to Ubuntu 20.04 LTS (GNU/Linux 5.4.0-29-generic x86_64)

 * Documentation:  https://help.ubuntu.com
 * Management:     https://landscape.canonical.com
 * Support:        https://ubuntu.com/advantage

  System information as of Mon Jun 29 06:48:28 UTC 2020

  System load:  0.13              Processes:             103
  Usage of /:   5.6% of 24.06GB   Users logged in:       0
  Memory usage: 19%               IPv4 address for eth0: $PUBLIC_IP
  Swap usage:   0%                IPv4 address for eth0: 10.19.0.5

65 updates can be installed immediately.
29 of these updates are security updates.
To see these additional updates run: apt list --upgradable


The programs included with the Ubuntu system are free software;
the exact distribution terms for each program are described in the
individual files in /usr/share/doc/*/copyright.

Ubuntu comes with ABSOLUTELY NO WARRANTY, to the extent permitted by
applicable law.

root@yetiops-prom-vm:~# ps aux | grep -i node
prometh+    2266  0.0  1.0 336924 10468 ?        Ssl  06:44   0:00 /usr/bin/prometheus-node-exporter
root       14312  0.0  0.0   8156   672 pts/0    S+   06:48   0:00 grep --color=auto -i node
Configure Terraform - Prometheus User
Digital Ocean have the option of creating applications with limited permissions, but it appears this is for Oauth2-based applications. Standard access tokens do not get the same level of fine grained permissions. With this being the case, we do not create a Prometheus user in Terraform. Instead, follow the steps above for creating an API key for Prometheus.
Prometheus
Now that we have our Droplet in Digital Ocean, we can configure our Prometheus instance. I am using an Ubuntu 20.04 virtual machine in my lab for this.
Digital Ocean Service Discovery
To allow Prometheus to discover instances in Digital Ocean, use configuration like the below: -
global:
  scrape_interval:     15s
  evaluation_interval: 15s

scrape_configs:
  - job_name: 'prometheus'
    static_configs:
    - targets:
      - 'localhost:9090'
  - job_name: 'do-nodes'
    digitalocean_sd_configs:
      - bearer_token: '$DIGITAL_OCEAN_PROMETHEUS_API_TOKEN'
        port: 9100
    relabel_configs:
      - source_labels: [__meta_digitalocean_tags]
        regex: .*,prometheus,.*
        action: keep
      - source_labels: [__meta_digitalocean_tags]
        regex: .*,node_exporter,.*
        action: keep
Replace $DIGITAL_OCEAN_PROMETHEUS_API_TOKEN with the token created above.
Notice that we have a digitalocean_tags metadata field, rather than each tag having its own field. Here is the AWS EC2 relabelling configuration for comparison: -
    relabel_configs:
      - source_labels: [__meta_ec2_tag_prometheus]
        regex: true.*
        action: keep
      - source_labels: [__meta_ec2_tag_node_exporter]
        regex: true.*
        action: keep
Because of this, rather than looking for the value true, we are using a regular expression to filter the contents of the tags field itself (looking for prometheus and node_exporter). If you run another exporter, like the HAProxy Exporter, you could use something like the following: -
  - job_name: 'do-nodes-haproxy'
    digitalocean_sd_configs:
      - bearer_token: '$DIGITAL_OCEAN_PROMETHEUS_API_TOKEN'
        port: 9101
    relabel_configs:
      - source_labels: [__meta_digitalocean_tags]
        regex: .*,prometheus,.*
        action: keep
      - source_labels: [__meta_digitalocean_tags]
        regex: .*,haproxy_exporter,.*
        action: keep
The Digital Ocean Service Discovery uses the Public IPv4 address of the Digital Ocean Droplet by default to target (unlike AWS, Azure or Google Cloud Platform, which uses the private IPv4). Because of this, we do not need to do any relabelling to reach it from an external source. Digital Ocean do have VPCs, so if you decide to run your Prometheus instance within Digital Ocean, you will want to relabel the target address to use the Private IPv4 address instead.
We can now look at the labels that the Digital Ocean Service Discovery generates: -
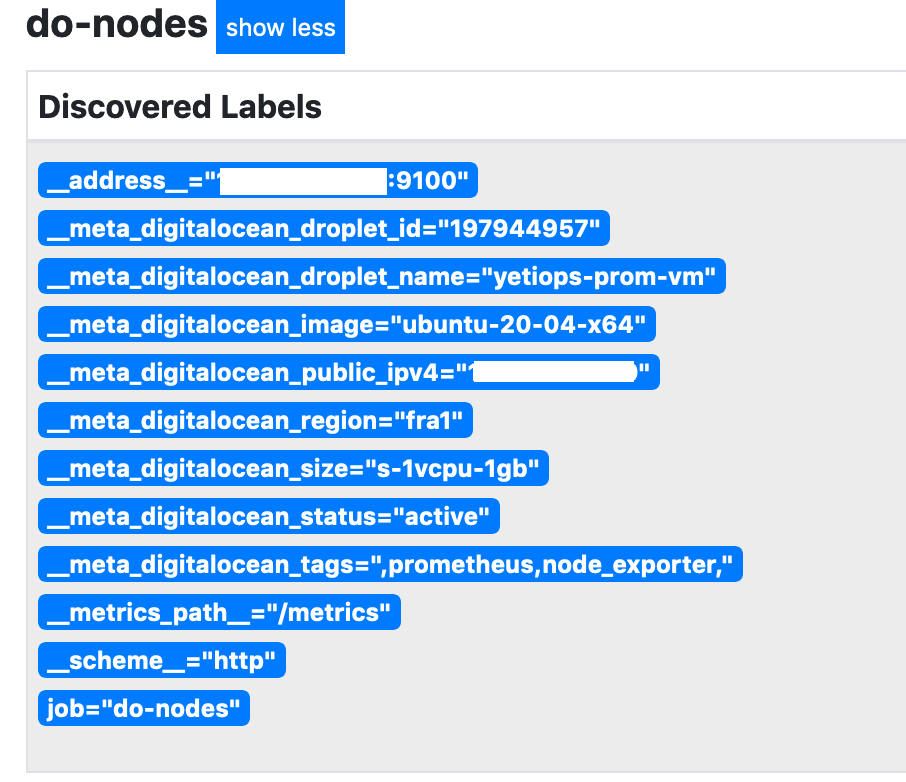
Notice the tags field which contains all of the tags we have assigned (and hence what we match upon).
Can we reach the node_exporter on the Droplet?
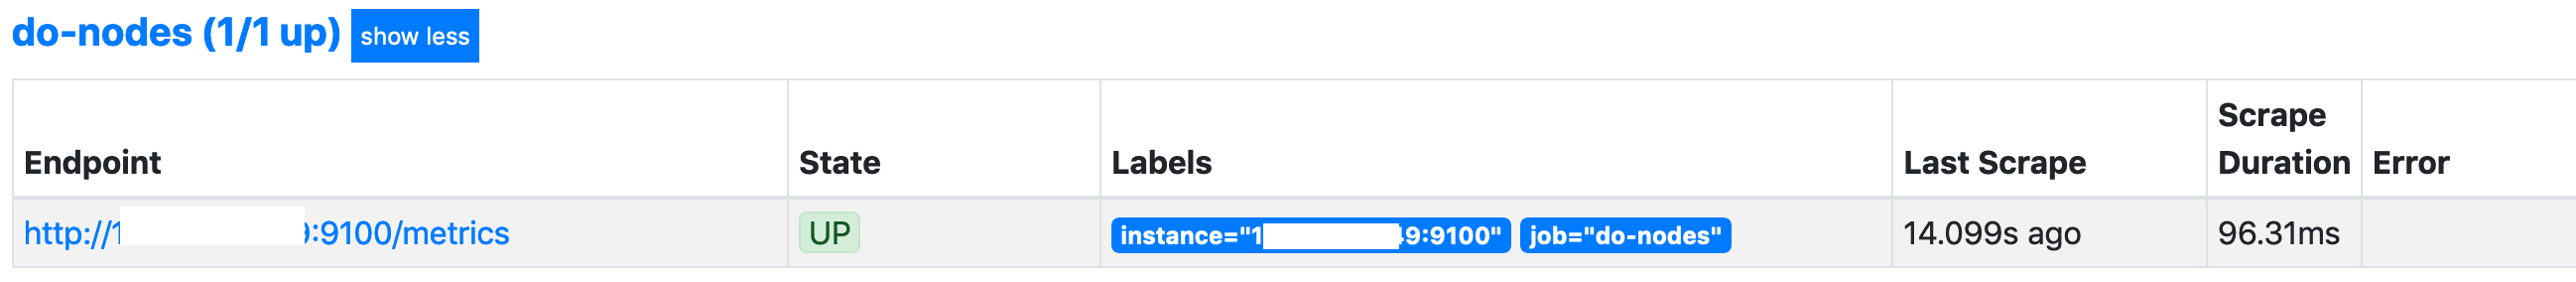
Yes we can, brilliant!
More efficient service discovery
Julien Pivotto (one of the contributors to Prometheus) made me aware that there is a more efficient way of using Prometheus Service Discovery with multiple targets
The approach in this post looks something like the below: -
  - job_name: 'do-nodes'
    digitalocean_sd_configs:
      - bearer_token: '$DIGITAL_OCEAN_PROMETHEUS_API_TOKEN'
        port: 9100
    relabel_configs:
      - source_labels: [__meta_digitalocean_tags]
        regex: .*,prometheus,.*
        action: keep
      - source_labels: [__meta_digitalocean_tags]
        regex: .*,node_exporter,.*
        action: keep
  - job_name: 'do-nodes-haproxy'
    digitalocean_sd_configs:
      - bearer_token: '$DIGITAL_OCEAN_PROMETHEUS_API_TOKEN'
        port: 9101
    relabel_configs:
      - source_labels: [__meta_digitalocean_tags]
        regex: .*,prometheus,.*
        action: keep
      - source_labels: [__meta_digitalocean_tags]
        regex: .*,haproxy_exporter,.*
        action: keep
In the first job we make the relevant API calls to the Digital Ocean API to retrieve the configured Droplets. When we get to the second job, we make the same API calls again to retrieve the configured Droplets. The more jobs you have, the more API calls Prometheus would make.
Instead, you can use something like: -
  - job_name: 'do-nodes'
    digitalocean_sd_configs:
      - bearer_token: '$DIGITAL_OCEAN_PROMETHEUS_API_TOKEN'
    relabel_configs:
      - source_labels: [__meta_digitalocean_tags]
        regex: .*,prometheus,.*
        action: keep
      - source_labels: [__meta_digitalocean_tags]
        regex: .*,node_exporter,.*
        action: keep
      - source_labels: [__meta_digitalocean_public_ipv4]
        target_label: __address__
        replacement: '$1:9100'
  - job_name: 'do-nodes-haproxy'
    digitalocean_sd_configs:
      - bearer_token: '$DIGITAL_OCEAN_PROMETHEUS_API_TOKEN'
    relabel_configs:
      - source_labels: [__meta_digitalocean_tags]
        regex: .*,prometheus,.*
        action: keep
      - source_labels: [__meta_digitalocean_tags]
        regex: .*,haproxy_exporter,.*
        action: keep
      - source_labels: [__meta_digitalocean_public_ipv4]
        target_label: __address__
        replacement: '$1:9101'
Because the jobs are using relabelling for the __address__ label (i.e. the Prometheus target address), they use the same Service Discovery API calls. All relabelling actions are performed locally, so they do not necessitate more API calls.
In the near future I will put a post together to compare the two approaches, so we can see the difference it makes.
Grafana
With the above, we can use any Node Exporter dashboard in Grafana to view all of the discovered instances. The Node Exporter Full is always a good start when using the Node Exporter: -
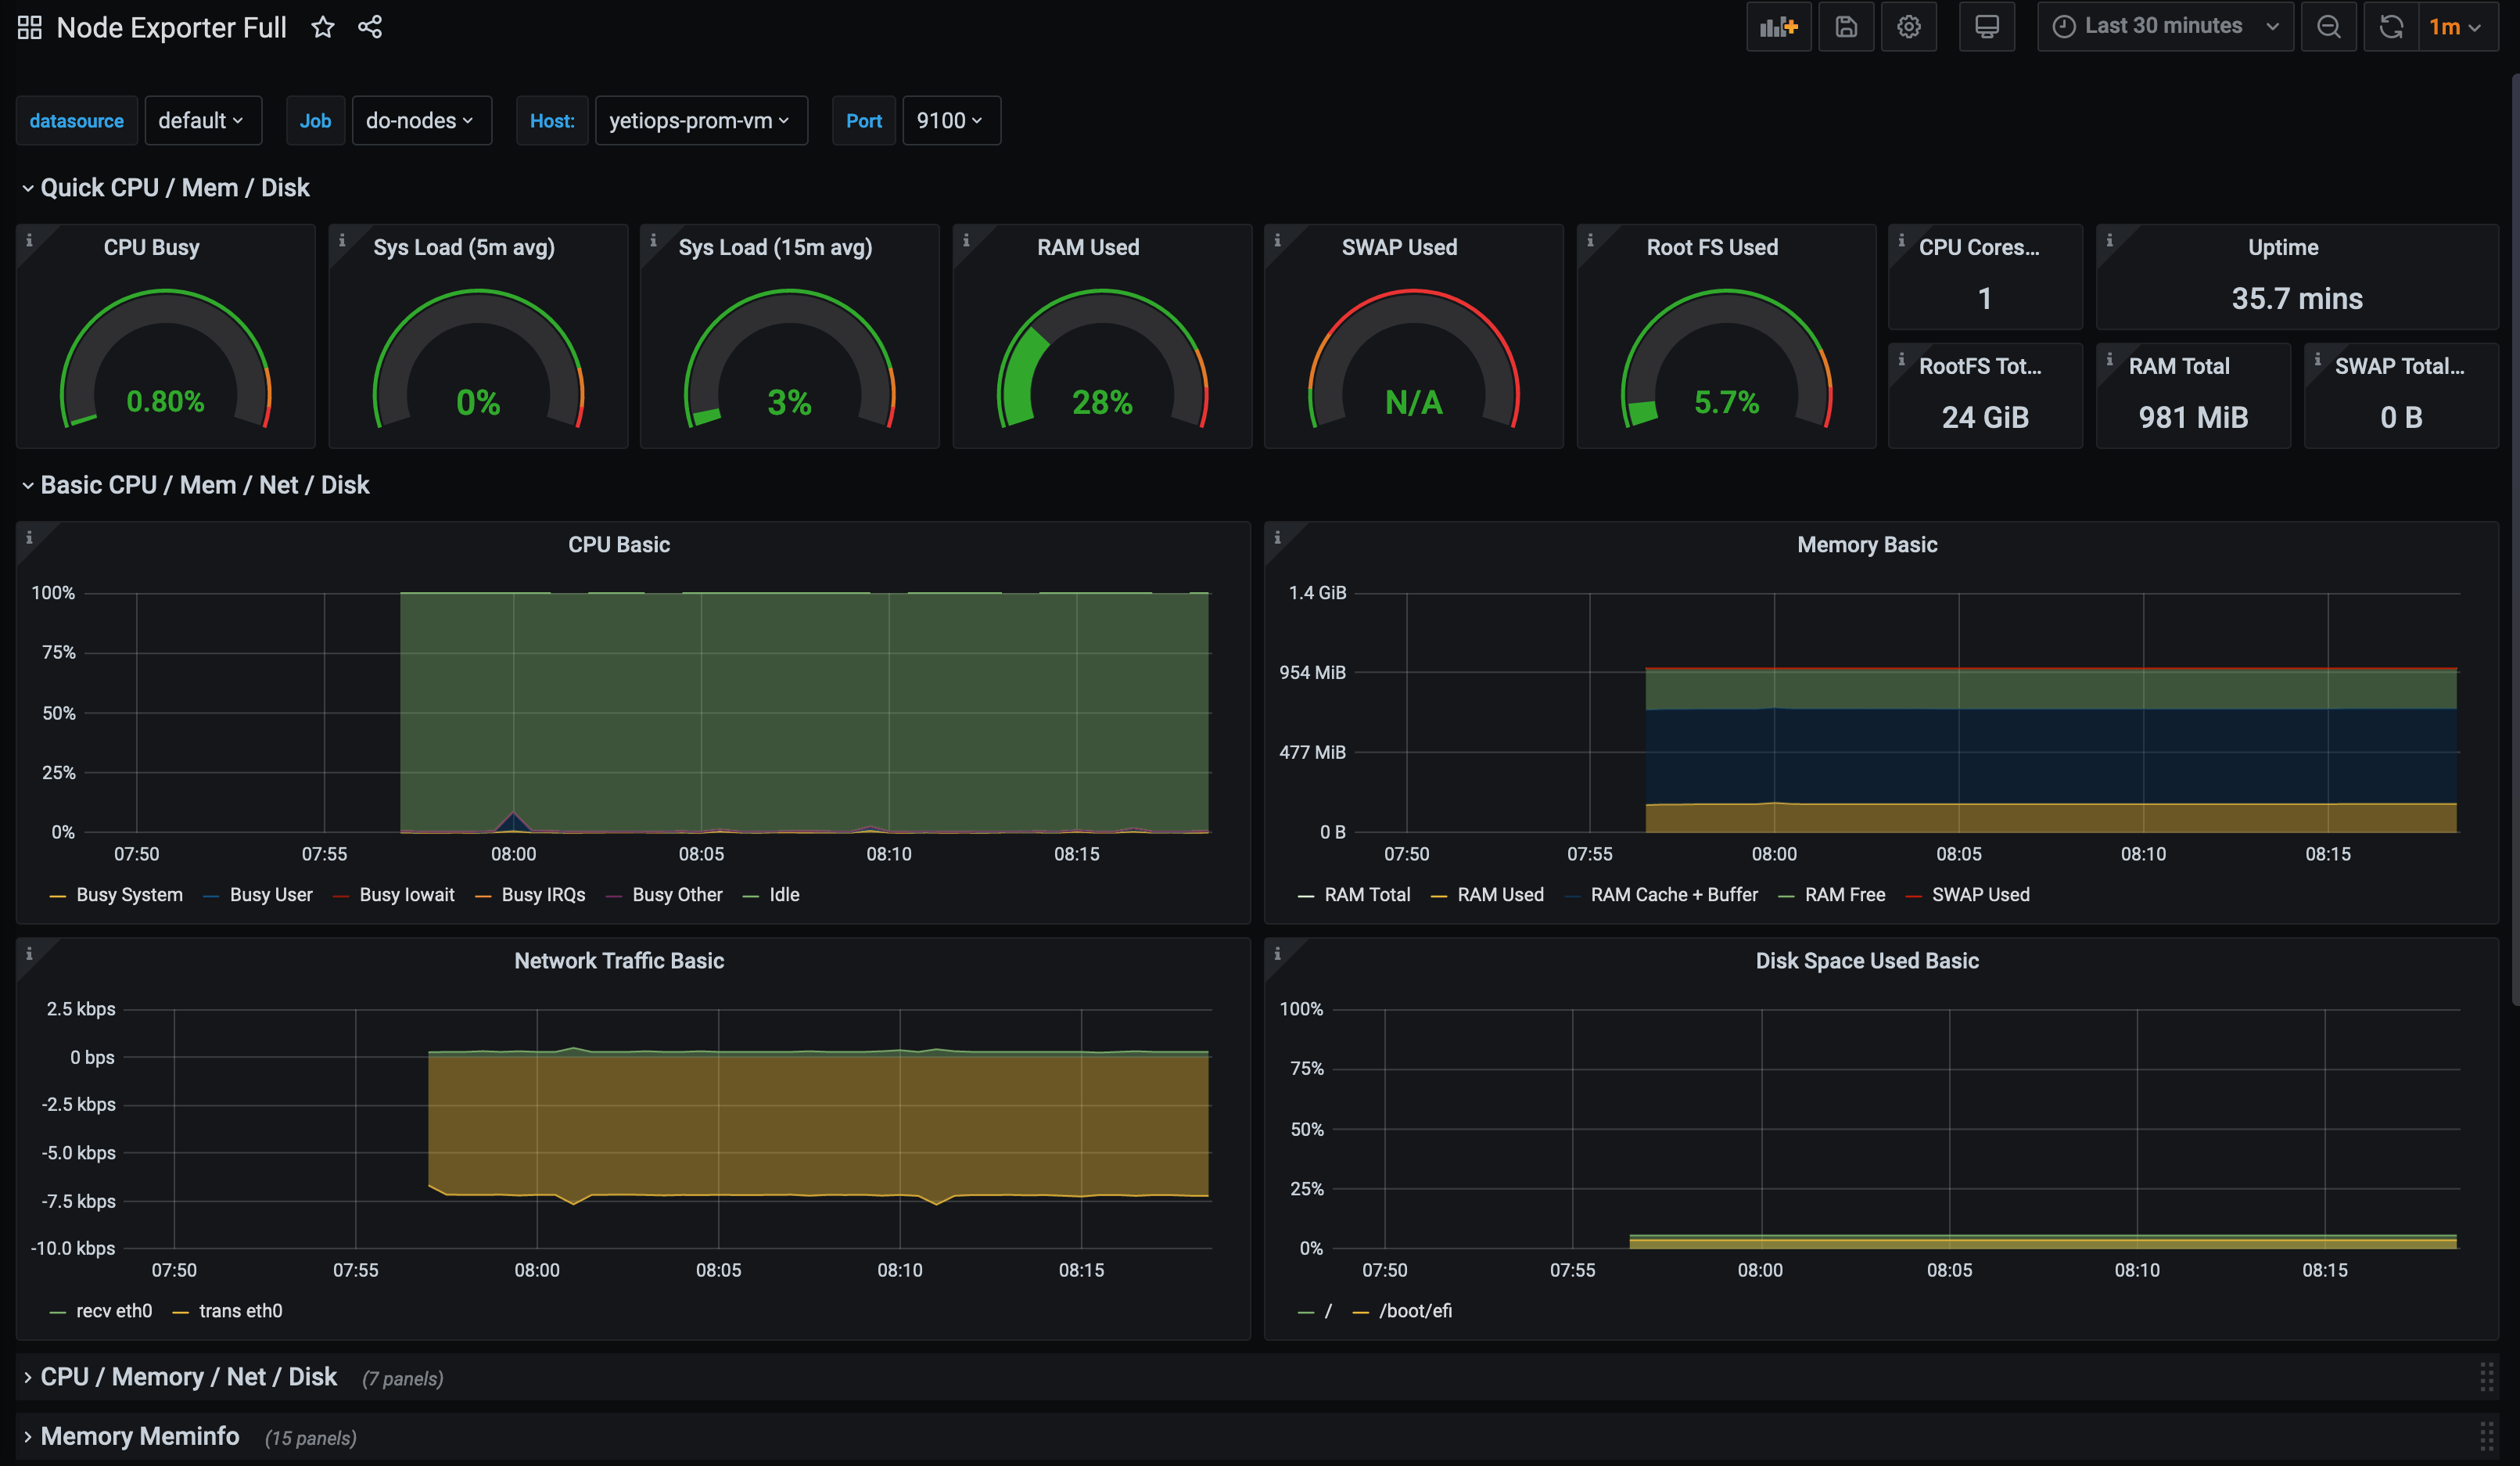
If we add more Droplets, they will also appear in this dashboard too.
Summary
Prometheus is constantly being improved, with new features that make it more compelling with every release.
The inclusion of the Digital Ocean service discovery mechanism means that those who either do not require the complexity of AWS, Azure or Google Cloud Platform, or just prefer them as a provider, no longer need to run other mechanisms (like Consul or other methods) to automatically discover the Droplets and services.
devops monitoring prometheus digitalocean terraform
technical prometheus monitoring cloud
3175 Words
2020-06-29 06:49 +0000